|
Download Data (XLS File) |
|
|||||
|
|||||
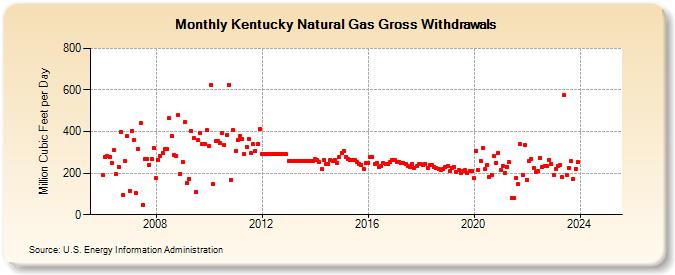
| Kentucky Natural Gas Gross Withdrawals (Million Cubic Feet per Day) | |||||
| Year | Jan | Feb | Mar | Apr | May | Jun | Jul | Aug | Sep | Oct | Nov | Dec |
|---|---|---|---|---|---|---|---|---|---|---|---|---|
| 2006 | 190 | 280 | 281 | 279 | 248 | 310 | 196 | 231 | 398 | 95 | 257 | 377 |
| 2007 | 115 | 404 | 361 | 105 | 315 | 441 | 45 | 268 | 270 | 240 | 268 | 320 |
| 2008 | 175 | 265 | 281 | 299 | 316 | 316 | 463 | 379 | 289 | 283 | 479 | 198 |
| 2009 | 254 | 445 | 151 | 174 | 402 | 368 | 109 | 359 | 391 | 339 | 339 | 406 |
| 2010 | 332 | 624 | 146 | 355 | 356 | 344 | 394 | 335 | 382 | 623 | 167 | 408 |
| 2011 | 308 | 359 | 379 | 366 | 292 | 327 | 365 | 295 | 339 | 307 | 340 | 410 |
| 2012 | 290 | 290 | 290 | 290 | 290 | 290 | 290 | 290 | 290 | 290 | 290 | 290 |
| 2013 | 259 | 259 | 259 | 259 | 259 | 259 | 259 | 259 | 259 | 259 | 259 | 259 |
| 2014 | 266 | 263 | 254 | 219 | 263 | 243 | 244 | 262 | 256 | 264 | 250 | 276 |
| 2015 | 299 | 307 | 279 | 268 | 262 | 265 | 263 | 254 | 246 | 241 | 222 | 248 |
| 2016 | 250 | 276 | 277 | 243 | 249 | 228 | 233 | 247 | 246 | 242 | 253 | 262 |
| 2017 | 262 | 252 | 255 | 248 | 248 | 243 | 235 | 230 | 244 | 225 | 235 | 243 |
| 2018 | 244 | 237 | 245 | 226 | 238 | 238 | 230 | 223 | 218 | 215 | 219 | 231 |
| 2019 | 232 | 209 | 226 | 231 | 207 | 213 | 201 | 210 | 213 | 199 | 211 | 208 |
| 2020 | 175 | 306 | 215 | 260 | 323 | 218 | 240 | 183 | 193 | 281 | 249 | 298 |
| 2021 | 213 | 232 | 199 | 231 | 252 | 81 | 78 | 176 | 147 | 338 | 193 | 335 |
| 2022 | 167 | 260 | 268 | 223 | 204 | 209 | 274 | 228 | 236 | 233 | 265 | 245 |
| 2023 | 167 | 170 | 168 | 166 | 166 | 167 | 167 | 167 | 166 | 161 | 163 | 160 |
| 2024 | 179 | 141 | 216 | 119 | 181 | 193 | 94 | 133 | 124 | 176 | 251 | 121 |
| 2025 | NA | NA | NA | NA | NA | NA | NA | NA | NA | NA | NA | NA |
| 2026 | NA | NA | NA | NA | ||||||||
| - = No Data Reported; -- = Not Applicable; NA = Not Available; W = Withheld to avoid disclosure of individual company data. |
| Release Date: 6/30/2026 |
| Next Release Date: 7/31/2026 |