|
Download Data (XLS File) |
|
|||||
|
|||||
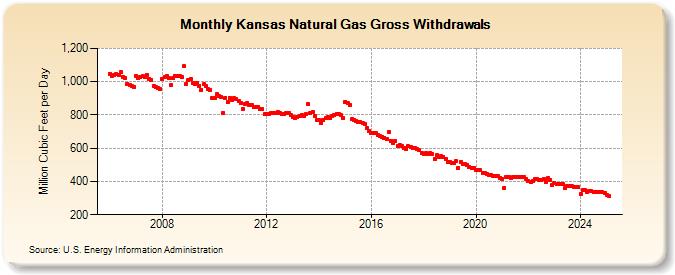
| Kansas Natural Gas Gross Withdrawals (Million Cubic Feet per Day) | |||||
| Year | Jan | Feb | Mar | Apr | May | Jun | Jul | Aug | Sep | Oct | Nov | Dec |
|---|---|---|---|---|---|---|---|---|---|---|---|---|
| 2006 | 1,049 | 1,035 | 1,041 | 1,046 | 1,041 | 1,057 | 1,030 | 1,024 | 988 | 979 | 975 | 968 |
| 2007 | 1,034 | 1,021 | 1,027 | 1,031 | 1,026 | 1,043 | 1,015 | 1,010 | 974 | 965 | 962 | 954 |
| 2008 | 1,017 | 1,028 | 1,032 | 1,024 | 979 | 1,024 | 1,034 | 1,033 | 1,032 | 1,026 | 1,092 | 988 |
| 2009 | 1,009 | 1,018 | 994 | 984 | 994 | 976 | 952 | 985 | 972 | 953 | 951 | 901 |
| 2010 | 903 | 923 | 911 | 907 | 812 | 902 | 876 | 904 | 890 | 899 | 895 | 886 |
| 2011 | 873 | 838 | 866 | 873 | 862 | 859 | 845 | 850 | 850 | 838 | 833 | 804 |
| 2012 | 807 | 805 | 811 | 809 | 814 | 819 | 812 | 808 | 807 | 812 | 812 | 798 |
| 2013 | 790 | 784 | 787 | 795 | 798 | 795 | 804 | 864 | 814 | 816 | 795 | 771 |
| 2014 | 768 | 749 | 767 | 779 | 786 | 784 | 792 | 798 | 806 | 807 | 797 | 782 |
| 2015 | 877 | 872 | 859 | 774 | 768 | 765 | 756 | 758 | 750 | 744 | 724 | 702 |
| 2016 | 693 | 690 | 690 | 678 | 674 | 669 | 664 | 656 | 695 | 645 | 630 | 642 |
| 2017 | 614 | 618 | 616 | 603 | 597 | 611 | 609 | 601 | 600 | 593 | 589 | 572 |
| 2018 | 564 | 570 | 567 | 570 | 566 | 537 | 557 | 546 | 551 | 544 | 536 | 516 |
| 2019 | 518 | 508 | 510 | 520 | 481 | 519 | 506 | 504 | 501 | 489 | 481 | 482 |
| 2020 | 471 | 470 | 467 | 453 | 452 | 444 | 441 | 436 | 434 | 434 | 431 | 423 |
| 2021 | 416 | 362 | 427 | 428 | 422 | 424 | 427 | 427 | 426 | 427 | 424 | 417 |
| 2022 | 403 | 397 | 402 | 412 | 414 | 411 | 409 | 414 | 396 | 420 | 408 | 380 |
| 2023 | 388 | 385 | 386 | 386 | 382 | 361 | 372 | 370 | 371 | 369 | 368 | 364 |
| 2024 | 328 | 355 | 352 | 350 | 348 | 344 | 346 | 343 | 342 | 342 | 340 | 339 |
| 2025 | 319 | 311 | 339 | 333 | 346 | 338 | 342 | 344 | 343 | 341 | 335 | 329 |
| 2026 | 310 | 330 | 326 | 327 | ||||||||
| - = No Data Reported; -- = Not Applicable; NA = Not Available; W = Withheld to avoid disclosure of individual company data. |
| Release Date: 6/30/2026 |
| Next Release Date: 7/31/2026 |