|
Download Data (XLS File) |
|
|||||
|
|||||
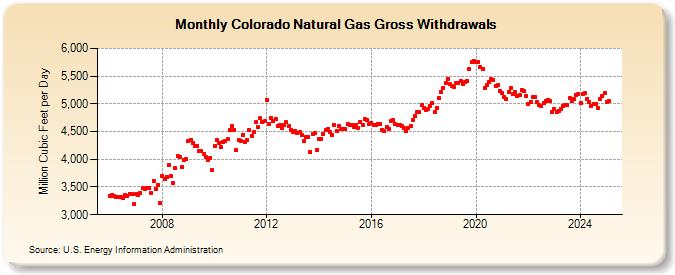
| Colorado Natural Gas Gross Withdrawals (Million Cubic Feet per Day) | |||||
| Year | Jan | Feb | Mar | Apr | May | Jun | Jul | Aug | Sep | Oct | Nov | Dec |
|---|---|---|---|---|---|---|---|---|---|---|---|---|
| 2006 | 3,344 | 3,357 | 3,340 | 3,314 | 3,325 | 3,313 | 3,299 | 3,357 | 3,329 | 3,380 | 3,369 | 3,202 |
| 2007 | 3,377 | 3,358 | 3,396 | 3,475 | 3,462 | 3,485 | 3,477 | 3,393 | 3,617 | 3,456 | 3,543 | 3,209 |
| 2008 | 3,707 | 3,645 | 3,679 | 3,900 | 3,707 | 3,576 | 3,834 | 4,056 | 4,049 | 3,860 | 3,978 | 3,998 |
| 2009 | 4,330 | 4,353 | 4,298 | 4,238 | 4,244 | 4,149 | 4,148 | 4,104 | 4,032 | 3,985 | 4,025 | 3,810 |
| 2010 | 4,233 | 4,350 | 4,295 | 4,220 | 4,306 | 4,337 | 4,359 | 4,523 | 4,600 | 4,527 | 4,161 | 4,348 |
| 2011 | 4,331 | 4,443 | 4,320 | 4,345 | 4,525 | 4,427 | 4,488 | 4,668 | 4,578 | 4,736 | 4,671 | 4,683 |
| 2012 | 5,076 | 4,632 | 4,740 | 4,685 | 4,729 | 4,596 | 4,617 | 4,564 | 4,612 | 4,665 | 4,596 | 4,525 |
| 2013 | 4,494 | 4,514 | 4,475 | 4,498 | 4,438 | 4,324 | 4,397 | 4,393 | 4,134 | 4,461 | 4,470 | 4,171 |
| 2014 | 4,374 | 4,372 | 4,454 | 4,522 | 4,545 | 4,496 | 4,432 | 4,610 | 4,516 | 4,608 | 4,546 | 4,546 |
| 2015 | 4,544 | 4,628 | 4,615 | 4,622 | 4,574 | 4,622 | 4,569 | 4,678 | 4,616 | 4,719 | 4,701 | 4,633 |
| 2016 | 4,661 | 4,615 | 4,612 | 4,641 | 4,630 | 4,531 | 4,505 | 4,588 | 4,552 | 4,692 | 4,700 | 4,628 |
| 2017 | 4,615 | 4,624 | 4,596 | 4,556 | 4,502 | 4,562 | 4,604 | 4,715 | 4,778 | 4,851 | 4,857 | 4,975 |
| 2018 | 4,925 | 4,887 | 4,904 | 4,969 | 5,022 | 4,859 | 4,925 | 5,104 | 5,210 | 5,291 | 5,379 | 5,445 |
| 2019 | 5,354 | 5,319 | 5,300 | 5,377 | 5,371 | 5,416 | 5,362 | 5,386 | 5,410 | 5,632 | 5,751 | 5,778 |
| 2020 | 5,755 | 5,754 | 5,662 | 5,621 | 5,292 | 5,331 | 5,399 | 5,441 | 5,432 | 5,330 | 5,335 | 5,230 |
| 2021 | 5,193 | 5,120 | 5,080 | 5,207 | 5,286 | 5,173 | 5,206 | 5,149 | 5,160 | 5,254 | 5,226 | 5,142 |
| 2022 | 5,003 | 5,032 | 5,119 | 5,120 | 5,029 | 4,974 | 4,966 | 5,006 | 5,055 | 5,070 | 5,051 | 4,858 |
| 2023 | 4,907 | 4,843 | 4,872 | 4,913 | 4,951 | 4,972 | 4,994 | 5,089 | 5,070 | 5,099 | 5,156 | 5,179 |
| 2024 | 4,993 | 5,163 | 5,174 | 5,044 | 5,009 | 4,927 | 4,946 | 4,957 | 4,920 | 5,091 | 5,136 | 5,194 |
| 2025 | 5,036 | 5,054 | 5,165 | 5,114 | 5,054 | 5,054 | 5,103 | 5,071 | 5,154 | 5,218 | 5,178 | 5,267 |
| 2026 | 5,191 | 5,279 | 5,204 | 5,193 | ||||||||
| - = No Data Reported; -- = Not Applicable; NA = Not Available; W = Withheld to avoid disclosure of individual company data. |
| Release Date: 6/30/2026 |
| Next Release Date: 7/31/2026 |