|
Download Data (XLS File) |
|
|||||
|
|||||
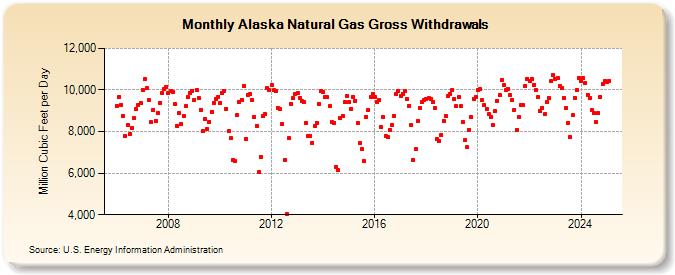
| Alaska Natural Gas Gross Withdrawals (Million Cubic Feet per Day) | |||||
| Year | Jan | Feb | Mar | Apr | May | Jun | Jul | Aug | Sep | Oct | Nov | Dec |
|---|---|---|---|---|---|---|---|---|---|---|---|---|
| 2006 | 9,244 | 9,681 | 9,288 | 8,745 | 7,770 | 8,330 | 7,865 | 8,192 | 8,642 | 9,084 | 9,268 | 9,369 |
| 2007 | 10,019 | 10,510 | 10,078 | 9,495 | 8,441 | 9,040 | 8,531 | 8,899 | 9,389 | 9,855 | 10,059 | 10,159 |
| 2008 | 9,833 | 9,963 | 9,894 | 9,323 | 8,290 | 8,875 | 8,375 | 8,739 | 9,221 | 9,674 | 9,876 | 9,972 |
| 2009 | 9,533 | 10,007 | 9,594 | 9,042 | 8,040 | 8,606 | 8,120 | 8,476 | 8,943 | 9,380 | 9,577 | 9,668 |
| 2010 | 9,389 | 9,849 | 9,966 | 9,107 | 8,009 | 7,666 | 6,641 | 6,593 | 8,809 | 9,442 | 9,534 | 10,214 |
| 2011 | 7,663 | 9,761 | 9,800 | 9,519 | 8,688 | 8,282 | 6,032 | 6,793 | 8,726 | 8,824 | 10,087 | 9,979 |
| 2012 | 10,262 | 9,980 | 9,939 | 9,127 | 9,072 | 8,384 | 6,637 | 4,023 | 7,666 | 9,341 | 9,604 | 9,821 |
| 2013 | 9,846 | 9,609 | 9,473 | 9,401 | 8,420 | 7,810 | 7,804 | 7,461 | 8,251 | 8,431 | 9,335 | 9,935 |
| 2014 | 9,882 | 9,653 | 9,645 | 9,240 | 8,466 | 8,415 | 6,296 | 6,140 | 8,662 | 8,757 | 9,412 | 9,730 |
| 2015 | 9,417 | 9,089 | 9,677 | 9,490 | 8,431 | 7,434 | 7,140 | 6,583 | 8,705 | 9,014 | 9,659 | 9,808 |
| 2016 | 9,639 | 9,424 | 9,524 | 8,204 | 8,684 | 7,794 | 7,724 | 8,077 | 8,309 | 8,772 | 9,805 | 9,952 |
| 2017 | 9,726 | 9,823 | 9,939 | 9,565 | 9,248 | 8,294 | 6,636 | 7,148 | 8,512 | 9,135 | 9,420 | 9,523 |
| 2018 | 9,573 | 9,593 | 9,542 | 9,424 | 9,121 | 7,634 | 7,550 | 7,835 | 8,520 | 8,744 | 9,694 | 9,828 |
| 2019 | 10,009 | 9,554 | 9,207 | 9,651 | 9,220 | 8,460 | 7,570 | 7,235 | 8,089 | 8,689 | 9,577 | 9,668 |
| 2020 | 9,989 | 10,051 | 9,505 | 9,280 | 9,091 | 8,830 | 8,716 | 8,302 | 8,997 | 9,486 | 9,748 | 10,497 |
| 2021 | 10,234 | 9,991 | 10,058 | 9,744 | 9,529 | 9,059 | 8,064 | 8,692 | 9,278 | 9,285 | 10,192 | 10,529 |
| 2022 | 10,430 | 10,549 | 10,247 | 9,993 | 9,655 | 8,967 | 9,154 | 8,838 | 9,413 | 9,610 | 10,410 | 10,714 |
| 2023 | 10,534 | 10,555 | 10,199 | 10,073 | 9,637 | 9,137 | 8,418 | 7,734 | 8,776 | 9,633 | 9,993 | 10,590 |
| 2024 | 10,455 | 10,572 | 10,350 | 9,774 | 9,619 | 9,020 | 8,883 | 8,460 | 8,889 | 9,675 | 10,278 | 10,419 |
| 2025 | 10,404 | 10,454 | 10,443 | 10,047 | 9,910 | 9,280 | 7,920 | 8,688 | 9,085 | 9,591 | 10,072 | 10,749 |
| 2026 | 10,560 | 10,380 | 10,623 | 10,335 | ||||||||
| - = No Data Reported; -- = Not Applicable; NA = Not Available; W = Withheld to avoid disclosure of individual company data. |
| Release Date: 6/30/2026 |
| Next Release Date: 7/31/2026 |