|
Download Data (XLS File) |
|
|||||
|
|||||
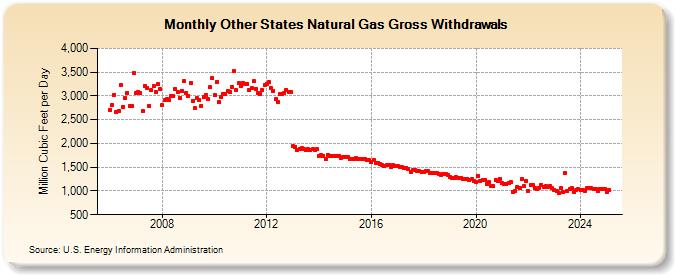
| Other States Natural Gas Gross Withdrawals (Million Cubic Feet per Day) | |||||
| Year | Jan | Feb | Mar | Apr | May | Jun | Jul | Aug | Sep | Oct | Nov | Dec |
|---|---|---|---|---|---|---|---|---|---|---|---|---|
| 2006 | 2,704 | 2,808 | 3,023 | 2,654 | 2,683 | 3,222 | 2,769 | 2,946 | 3,068 | 2,783 | 2,798 | 3,479 |
| 2007 | 3,055 | 3,091 | 3,058 | 2,678 | 3,215 | 3,158 | 2,795 | 3,121 | 3,207 | 3,085 | 3,245 | 3,150 |
| 2008 | 2,800 | 2,909 | 2,931 | 2,924 | 3,001 | 2,995 | 3,150 | 3,092 | 2,953 | 3,113 | 3,311 | 3,064 |
| 2009 | 3,006 | 3,280 | 2,901 | 2,750 | 2,946 | 2,912 | 2,792 | 2,979 | 3,019 | 2,945 | 3,179 | 3,369 |
| 2010 | 3,017 | 3,301 | 2,877 | 2,977 | 3,042 | 3,046 | 3,103 | 3,079 | 3,194 | 3,520 | 3,122 | 3,264 |
| 2011 | 3,206 | 3,279 | 3,251 | 3,261 | 3,116 | 3,160 | 3,308 | 3,149 | 3,071 | 3,042 | 3,124 | 3,220 |
| 2012 | 3,255 | 3,286 | 3,158 | 3,113 | 2,925 | 2,880 | 3,031 | 3,039 | 3,070 | 3,127 | 3,083 | 3,078 |
| 2013 | 1,943 | 1,934 | 1,872 | 1,893 | 1,902 | 1,880 | 1,871 | 1,878 | 1,859 | 1,877 | 1,871 | 1,877 |
| 2014 | 1,746 | 1,755 | 1,746 | 1,663 | 1,762 | 1,728 | 1,728 | 1,736 | 1,739 | 1,733 | 1,702 | 1,723 |
| 2015 | 1,717 | 1,711 | 1,675 | 1,668 | 1,664 | 1,695 | 1,673 | 1,675 | 1,671 | 1,664 | 1,646 | 1,643 |
| 2016 | 1,615 | 1,649 | 1,597 | 1,588 | 1,562 | 1,540 | 1,532 | 1,540 | 1,547 | 1,513 | 1,545 | 1,525 |
| 2017 | 1,515 | 1,509 | 1,505 | 1,492 | 1,493 | 1,458 | 1,401 | 1,433 | 1,446 | 1,418 | 1,416 | 1,406 |
| 2018 | 1,392 | 1,413 | 1,415 | 1,378 | 1,377 | 1,371 | 1,371 | 1,352 | 1,346 | 1,348 | 1,350 | 1,339 |
| 2019 | 1,302 | 1,279 | 1,283 | 1,290 | 1,270 | 1,279 | 1,251 | 1,256 | 1,256 | 1,223 | 1,242 | 1,213 |
| 2020 | 1,188 | 1,319 | 1,216 | 1,235 | 1,234 | 1,148 | 1,189 | 1,111 | 1,106 | 1,239 | 1,206 | 1,253 |
| 2021 | 1,158 | 1,141 | 1,139 | 1,168 | 1,178 | 986 | 1,004 | 1,091 | 1,052 | 1,246 | 1,098 | 1,214 |
| 2022 | 1,007 | 1,128 | 1,118 | 1,060 | 1,048 | 1,060 | 1,134 | 1,083 | 1,100 | 1,087 | 1,106 | 1,055 |
| 2023 | 991 | 943 | 884 | 985 | 970 | 970 | 976 | 977 | 972 | 966 | 959 | 944 |
| 2024 | 942 | 896 | 965 | 872 | 933 | 939 | 837 | 872 | 831 | 914 | 958 | 847 |
| 2025 | 973 | 1,026 | 1,011 | 1,009 | 1,010 | 994 | 1,001 | 987 | 977 | 971 | 925 | 927 |
| 2026 | 970 | 916 | 933 | 949 | ||||||||
| - = No Data Reported; -- = Not Applicable; NA = Not Available; W = Withheld to avoid disclosure of individual company data. |
| Release Date: 6/30/2026 |
| Next Release Date: 7/31/2026 |