|
Download Data (XLS File) |
|
|||||
|
|||||
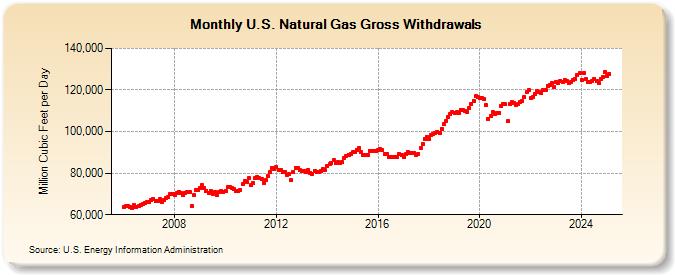
| U.S. Natural Gas Gross Withdrawals (Million Cubic Feet per Day) | |||||
| Year | Jan | Feb | Mar | Apr | May | Jun | Jul | Aug | Sep | Oct | Nov | Dec |
|---|---|---|---|---|---|---|---|---|---|---|---|---|
| 2006 | 63,715 | 64,080 | 64,338 | 63,633 | 63,114 | 64,627 | 63,717 | 64,175 | 64,870 | 65,348 | 65,811 | 66,321 |
| 2007 | 65,899 | 67,072 | 67,566 | 66,498 | 66,666 | 67,329 | 66,235 | 66,975 | 68,008 | 68,458 | 69,953 | 70,200 |
| 2008 | 69,517 | 70,476 | 71,100 | 70,420 | 69,462 | 70,626 | 71,137 | 70,760 | 63,984 | 69,464 | 71,662 | 71,840 |
| 2009 | 72,643 | 74,077 | 72,983 | 71,595 | 70,659 | 71,351 | 70,001 | 70,729 | 69,641 | 70,876 | 71,472 | 70,849 |
| 2010 | 71,296 | 73,136 | 73,437 | 73,009 | 72,145 | 71,292 | 71,250 | 72,098 | 74,605 | 76,031 | 75,890 | 77,433 |
| 2011 | 74,171 | 75,155 | 77,770 | 78,324 | 77,770 | 77,098 | 75,493 | 76,466 | 78,606 | 80,722 | 82,532 | 82,056 |
| 2012 | 82,947 | 81,381 | 81,428 | 80,583 | 80,345 | 79,226 | 79,518 | 76,579 | 80,346 | 82,488 | 82,379 | 81,412 |
| 2013 | 81,033 | 81,068 | 80,774 | 81,544 | 80,280 | 79,513 | 81,046 | 80,487 | 80,480 | 81,070 | 81,839 | 81,483 |
| 2014 | 83,226 | 84,178 | 84,642 | 86,129 | 84,944 | 85,334 | 84,811 | 85,321 | 87,517 | 88,249 | 88,731 | 89,357 |
| 2015 | 90,002 | 90,018 | 91,210 | 91,958 | 90,027 | 88,672 | 88,910 | 88,540 | 90,715 | 90,519 | 90,874 | 90,713 |
| 2016 | 91,068 | 91,512 | 91,128 | 89,287 | 89,285 | 87,605 | 87,781 | 87,827 | 87,540 | 87,748 | 89,275 | 88,598 |
| 2017 | 87,859 | 89,045 | 90,230 | 89,666 | 89,644 | 89,614 | 88,839 | 89,344 | 92,110 | 93,915 | 96,567 | 97,594 |
| 2018 | 96,554 | 98,258 | 99,009 | 99,204 | 99,953 | 99,091 | 101,234 | 103,425 | 105,133 | 106,925 | 108,664 | 109,402 |
| 2019 | 108,927 | 109,176 | 109,130 | 110,509 | 110,452 | 109,993 | 109,548 | 111,229 | 113,219 | 114,580 | 116,976 | 116,855 |
| 2020 | 116,077 | 116,080 | 115,480 | 112,533 | 106,149 | 107,364 | 109,243 | 108,655 | 109,139 | 109,081 | 112,374 | 113,421 |
| 2021 | 113,036 | 104,951 | 113,218 | 114,280 | 113,704 | 112,992 | 113,183 | 114,030 | 114,691 | 116,546 | 118,815 | 119,985 |
| 2022 | 115,921 | 116,788 | 118,228 | 119,298 | 118,791 | 118,495 | 119,873 | 119,855 | 121,934 | 122,573 | 123,440 | 121,399 |
| 2023 | 123,902 | 123,429 | 124,416 | 123,943 | 124,486 | 122,918 | 122,589 | 122,816 | 124,092 | 125,035 | 127,075 | 127,815 |
| 2024 | 124,962 | 127,607 | 124,828 | 123,769 | 123,530 | 124,416 | 125,637 | 124,415 | 123,527 | 125,775 | 126,572 | 128,872 |
| 2025 | 126,860 | 127,834 | 130,894 | 130,192 | 129,795 | 130,153 | 129,762 | 131,168 | 131,356 | 130,785 | 134,336 | 136,008 |
| 2026 | 132,249 | 134,676 | 135,373 | 135,292 | ||||||||
| - = No Data Reported; -- = Not Applicable; NA = Not Available; W = Withheld to avoid disclosure of individual company data. |
| Release Date: 6/30/2026 |
| Next Release Date: 7/31/2026 |