|
Download Data (XLS File) |
|
||||||||
|
||||||||
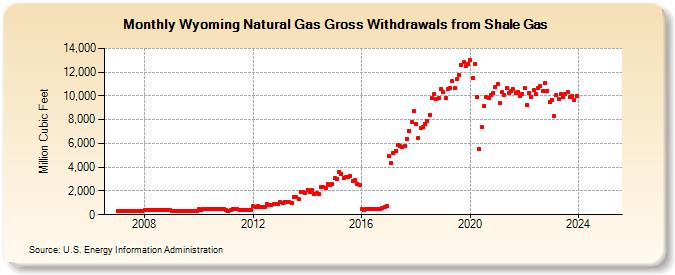
| Wyoming Natural Gas Gross Withdrawals from Shale Gas (Million Cubic Feet) | ||||||||
| Year | Jan | Feb | Mar | Apr | May | Jun | Jul | Aug | Sep | Oct | Nov | Dec |
|---|---|---|---|---|---|---|---|---|---|---|---|---|
| 2007 | 331 | 299 | 331 | 320 | 331 | 320 | 331 | 331 | 320 | 331 | 320 | 331 |
| 2008 | 405 | 378 | 405 | 392 | 405 | 392 | 405 | 405 | 392 | 405 | 392 | 405 |
| 2009 | 344 | 311 | 344 | 333 | 344 | 333 | 344 | 344 | 333 | 344 | 333 | 344 |
| 2010 | 457 | 414 | 460 | 474 | 480 | 444 | 475 | 484 | 460 | 461 | 451 | 457 |
| 2011 | 397 | 353 | 395 | 443 | 449 | 440 | 415 | 380 | 393 | 366 | 362 | 361 |
| 2012 | 743 | 675 | 723 | 637 | 648 | 622 | 867 | 859 | 827 | 904 | 888 | 861 |
| 2013 | 1,059 | 971 | 1,078 | 1,040 | 1,029 | 1,023 | 1,481 | 1,472 | 1,331 | 1,951 | 1,884 | 1,857 |
| 2014 | 2,085 | 1,883 | 2,085 | 1,736 | 1,794 | 1,736 | 2,326 | 2,326 | 2,251 | 2,548 | 2,466 | 2,548 |
| 2015 | 3,075 | 3,035 | 3,627 | 3,466 | 3,104 | 3,182 | 3,165 | 3,242 | 2,857 | 2,915 | 2,622 | 2,502 |
| 2016 | 499 | 431 | 472 | 523 | 485 | 472 | 468 | 451 | 442 | 607 | 627 | 716 |
| 2017 | 4,906 | 4,365 | 5,214 | 5,350 | 5,879 | 5,771 | 5,670 | 5,769 | 6,392 | 7,087 | 7,803 | 8,706 |
| 2018 | 7,665 | 6,445 | 7,304 | 7,403 | 7,633 | 7,861 | 8,413 | 9,821 | 10,161 | 9,774 | 9,819 | 10,546 |
| 2019 | 10,302 | 9,853 | 10,613 | 10,660 | 11,223 | 10,665 | 11,383 | 11,775 | 12,618 | 12,816 | 12,483 | 12,681 |
| 2020 | 13,040 | 11,523 | 12,724 | 9,904 | 5,514 | 7,356 | 9,117 | 9,906 | 9,814 | 10,059 | 10,212 | 10,764 |
| 2021 | 10,987 | 9,371 | 10,313 | 10,117 | 10,668 | 10,285 | 10,434 | 10,570 | 10,257 | 10,336 | 10,011 | 10,190 |
| 2022 | 10,664 | 9,196 | 10,229 | 9,887 | 10,466 | 10,186 | 10,634 | 10,811 | 10,440 | 11,081 | 10,441 | 9,482 |
| 2023 | 9,662 | 8,270 | 10,039 | 9,745 | 10,125 | 9,939 | 10,175 | 10,315 | 9,906 | 10,003 | 9,635 | 9,972 |
| 2024 | 9,047 | 9,216 | 9,934 | 9,158 | 9,712 | 9,222 | 9,567 | 9,731 | 9,154 | 9,431 | 8,884 | 9,064 |
| 2025 | NA | NA | NA | NA | NA | NA | NA | NA | NA | NA | NA | NA |
| 2026 | NA | NA | NA | NA | ||||||||
| - = No Data Reported; -- = Not Applicable; NA = Not Available; W = Withheld to avoid disclosure of individual company data. |
| Release Date: 6/30/2026 |
| Next Release Date: 7/31/2026 |