|
Download Data (XLS File) |
|
||||||||
|
||||||||
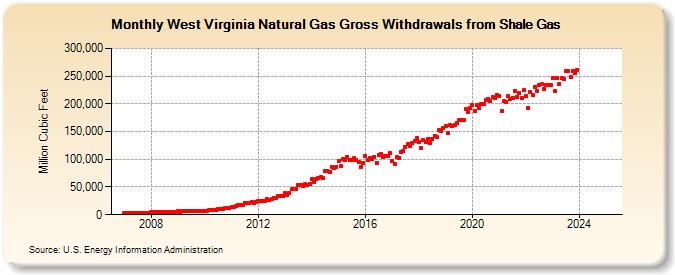
| West Virginia Natural Gas Gross Withdrawals from Shale Gas (Million Cubic Feet) | ||||||||
| Year | Jan | Feb | Mar | Apr | May | Jun | Jul | Aug | Sep | Oct | Nov | Dec |
|---|---|---|---|---|---|---|---|---|---|---|---|---|
| 2007 | 3,441 | 3,108 | 3,441 | 3,330 | 3,441 | 3,330 | 3,441 | 3,441 | 3,330 | 3,441 | 3,330 | 3,441 |
| 2008 | 4,526 | 4,234 | 4,526 | 4,380 | 4,526 | 4,380 | 4,526 | 4,526 | 4,380 | 4,526 | 4,380 | 4,526 |
| 2009 | 6,076 | 5,488 | 6,076 | 5,880 | 6,076 | 5,880 | 6,076 | 6,076 | 5,880 | 6,076 | 5,880 | 6,076 |
| 2010 | 7,544 | 6,900 | 7,606 | 8,245 | 8,558 | 8,405 | 10,065 | 10,068 | 9,859 | 12,372 | 12,016 | 12,136 |
| 2011 | 13,764 | 13,153 | 15,203 | 16,974 | 17,785 | 18,022 | 21,093 | 20,783 | 21,788 | 22,896 | 21,994 | 23,558 |
| 2012 | 25,375 | 24,058 | 25,054 | 25,441 | 27,912 | 26,994 | 28,110 | 30,176 | 29,485 | 34,228 | 33,685 | 34,330 |
| 2013 | 38,540 | 34,810 | 38,540 | 45,754 | 47,279 | 45,754 | 53,019 | 53,019 | 51,309 | 55,279 | 53,496 | 55,279 |
| 2014 | 64,371 | 58,142 | 64,371 | 66,190 | 68,396 | 66,190 | 79,403 | 79,403 | 76,841 | 86,636 | 83,842 | 86,636 |
| 2015 | 96,995 | 87,390 | 100,806 | 98,572 | 104,956 | 98,838 | 98,371 | 101,625 | 99,049 | 95,361 | 85,251 | 93,991 |
| 2016 | 105,718 | 98,625 | 101,762 | 101,193 | 104,567 | 93,914 | 108,458 | 110,364 | 104,627 | 105,954 | 106,163 | 111,107 |
| 2017 | 97,650 | 90,862 | 104,760 | 103,078 | 113,916 | 114,648 | 122,162 | 126,690 | 123,084 | 129,880 | 132,623 | 137,808 |
| 2018 | 130,633 | 119,928 | 133,961 | 130,595 | 137,113 | 129,778 | 137,121 | 142,406 | 140,709 | 152,932 | 150,415 | 156,775 |
| 2019 | 159,946 | 146,530 | 162,113 | 159,184 | 162,174 | 165,615 | 170,300 | 170,799 | 170,160 | 190,813 | 185,375 | 193,288 |
| 2020 | 198,142 | 187,236 | 198,321 | 191,972 | 199,796 | 200,458 | 207,214 | 209,282 | 205,425 | 211,681 | 209,696 | 216,777 |
| 2021 | 214,496 | 187,393 | 205,032 | 203,107 | 213,581 | 208,588 | 210,239 | 223,296 | 212,354 | 219,250 | 209,980 | 224,195 |
| 2022 | 214,755 | 193,332 | 220,609 | 216,719 | 229,756 | 222,782 | 233,224 | 235,579 | 227,008 | 233,745 | 233,582 | 234,051 |
| 2023 | 251,347 | 227,497 | 250,760 | 241,245 | 250,855 | 250,513 | 265,149 | 265,160 | 253,578 | 263,722 | 260,209 | 266,122 |
| 2024 | 279,175 | 261,425 | 276,368 | 268,688 | 274,629 | 270,639 | 285,806 | 282,232 | 274,047 | 287,333 | 278,531 | 288,541 |
| 2025 | NA | NA | NA | NA | NA | NA | NA | NA | NA | NA | NA | NA |
| 2026 | NA | NA | NA | NA | ||||||||
| - = No Data Reported; -- = Not Applicable; NA = Not Available; W = Withheld to avoid disclosure of individual company data. |
| Release Date: 6/30/2026 |
| Next Release Date: 7/31/2026 |