|
Download Data (XLS File) |
|
||||||||
|
||||||||
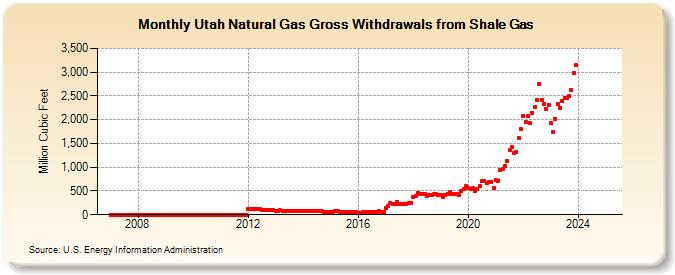
| Utah Natural Gas Gross Withdrawals from Shale Gas (Million Cubic Feet) | ||||||||
| Year | Jan | Feb | Mar | Apr | May | Jun | Jul | Aug | Sep | Oct | Nov | Dec |
|---|---|---|---|---|---|---|---|---|---|---|---|---|
| 2007 | 0 | 0 | 0 | 0 | 0 | 0 | 0 | 0 | 0 | 0 | 0 | 0 |
| 2008 | 0 | 0 | 0 | 0 | 0 | 0 | 0 | 0 | 0 | 0 | 0 | 0 |
| 2009 | 0 | 0 | 0 | 0 | 0 | 0 | 0 | 0 | 0 | 0 | 0 | 0 |
| 2010 | 0 | 0 | 0 | 0 | 0 | 0 | 0 | 0 | 0 | 0 | 0 | 0 |
| 2011 | 0 | 0 | 0 | 0 | 0 | 0 | 0 | 0 | 0 | 0 | 0 | 0 |
| 2012 | 119 | 115 | 123 | 117 | 121 | 119 | 108 | 107 | 105 | 104 | 97 | 96 |
| 2013 | 85 | 81 | 90 | 82 | 84 | 80 | 82 | 83 | 81 | 85 | 80 | 78 |
| 2014 | 80 | 73 | 80 | 76 | 79 | 76 | 73 | 73 | 71 | 65 | 63 | 65 |
| 2015 | 66 | 60 | 71 | 68 | 67 | 60 | 64 | 64 | 58 | 59 | 55 | 54 |
| 2016 | 43 | 39 | 48 | 52 | 51 | 56 | 64 | 65 | 67 | 72 | 61 | 47 |
| 2017 | 142 | 177 | 248 | 227 | 233 | 258 | 219 | 225 | 227 | 233 | 251 | 252 |
| 2018 | 379 | 388 | 463 | 437 | 426 | 435 | 403 | 411 | 414 | 438 | 429 | 420 |
| 2019 | 420 | 369 | 425 | 434 | 475 | 431 | 439 | 446 | 415 | 494 | 537 | 600 |
| 2020 | 566 | 542 | 565 | 490 | 542 | 603 | 708 | 709 | 660 | 680 | 694 | 568 |
| 2021 | 720 | 719 | 937 | 972 | 1,024 | 1,120 | 1,354 | 1,418 | 1,308 | 1,317 | 1,620 | 1,798 |
| 2022 | 2,073 | 1,960 | 2,071 | 1,921 | 2,150 | 2,266 | 2,422 | 2,745 | 2,423 | 2,323 | 2,219 | 2,317 |
| 2023 | 1,997 | 1,799 | 2,086 | 2,420 | 2,317 | 2,385 | 2,626 | 2,630 | 2,575 | 2,718 | 2,942 | 3,200 |
| 2024 | 3,148 | 2,763 | 2,772 | 2,726 | 2,982 | 2,823 | 3,175 | 3,107 | 3,147 | 3,597 | 3,298 | 3,103 |
| 2025 | NA | NA | NA | NA | NA | NA | NA | NA | NA | NA | NA | NA |
| 2026 | NA | NA | NA | NA | ||||||||
| - = No Data Reported; -- = Not Applicable; NA = Not Available; W = Withheld to avoid disclosure of individual company data. |
| Release Date: 6/30/2026 |
| Next Release Date: 7/31/2026 |