|
Download Data (XLS File) |
|
||||||||
|
||||||||
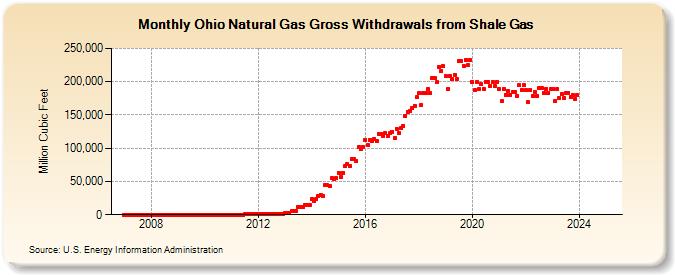
| Ohio Natural Gas Gross Withdrawals from Shale Gas (Million Cubic Feet) | ||||||||
| Year | Jan | Feb | Mar | Apr | May | Jun | Jul | Aug | Sep | Oct | Nov | Dec |
|---|---|---|---|---|---|---|---|---|---|---|---|---|
| 2007 | 1 | 1 | 1 | 1 | 1 | 1 | 1 | 1 | 1 | 1 | 1 | 1 |
| 2008 | 1 | 1 | 1 | 1 | 1 | 1 | 1 | 1 | 1 | 1 | 1 | 1 |
| 2009 | 1 | 1 | 1 | 1 | 1 | 1 | 1 | 1 | 1 | 1 | 1 | 1 |
| 2010 | 1 | 1 | 1 | 1 | 1 | 1 | 1 | 1 | 1 | 1 | 1 | 1 |
| 2011 | 1 | 1 | 1 | 50 | 50 | 48 | 333 | 333 | 328 | 458 | 458 | 480 |
| 2012 | 414 | 374 | 414 | 818 | 845 | 818 | 1,262 | 1,262 | 1,221 | 1,802 | 1,743 | 1,802 |
| 2013 | 2,858 | 2,581 | 2,858 | 4,967 | 5,132 | 4,967 | 11,332 | 11,332 | 10,967 | 14,531 | 14,062 | 14,531 |
| 2014 | 22,960 | 20,738 | 22,960 | 28,811 | 29,771 | 28,811 | 43,962 | 43,962 | 42,544 | 55,022 | 53,247 | 55,022 |
| 2015 | 63,341 | 57,211 | 63,341 | 73,207 | 75,647 | 73,207 | 83,458 | 83,458 | 80,766 | 101,939 | 98,650 | 101,939 |
| 2016 | 112,264 | 105,022 | 112,264 | 110,416 | 114,096 | 110,416 | 121,804 | 121,804 | 117,875 | 122,570 | 118,616 | 122,570 |
| 2017 | 124,995 | 115,144 | 129,381 | 123,398 | 130,356 | 133,978 | 148,779 | 155,003 | 155,183 | 160,564 | 164,145 | 176,531 |
| 2018 | 182,619 | 165,123 | 182,831 | 182,287 | 188,609 | 182,652 | 205,225 | 205,520 | 199,098 | 222,506 | 215,538 | 222,784 |
| 2019 | 208,829 | 188,766 | 209,038 | 203,690 | 210,630 | 204,001 | 230,823 | 231,113 | 223,774 | 232,467 | 225,102 | 232,638 |
| 2020 | 199,626 | 186,906 | 199,873 | 189,242 | 195,724 | 189,451 | 199,997 | 200,074 | 193,793 | 199,357 | 193,015 | 199,531 |
| 2021 | 188,901 | 170,370 | 188,750 | 180,483 | 186,475 | 179,211 | 184,196 | 184,196 | 178,254 | 194,235 | 187,970 | 194,235 |
| 2022 | 187,306 | 169,179 | 187,306 | 178,641 | 184,596 | 178,641 | 189,715 | 189,715 | 183,595 | 189,113 | 183,012 | 189,113 |
| 2023 | 189,481 | 171,296 | 189,518 | 175,472 | 179,270 | 173,630 | 182,024 | 182,183 | 176,276 | 179,395 | 173,785 | 179,407 |
| 2024 | 180,750 | 169,154 | 180,847 | 172,912 | 178,775 | 173,024 | 177,980 | 178,063 | 172,418 | 180,108 | 172,664 | 178,572 |
| 2025 | NA | NA | NA | NA | NA | NA | NA | NA | NA | NA | NA | NA |
| 2026 | NA | NA | NA | NA | ||||||||
| - = No Data Reported; -- = Not Applicable; NA = Not Available; W = Withheld to avoid disclosure of individual company data. |
| Release Date: 6/30/2026 |
| Next Release Date: 7/31/2026 |