|
Download Data (XLS File) |
|
||||||||
|
||||||||
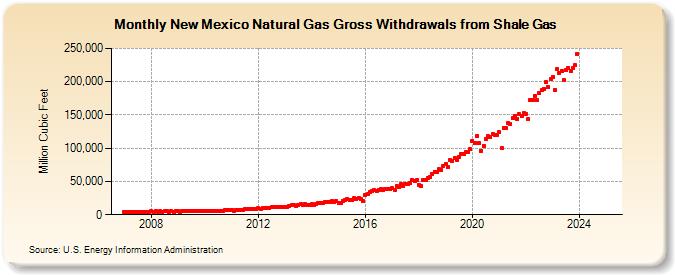
| New Mexico Natural Gas Gross Withdrawals from Shale Gas (Million Cubic Feet) | ||||||||
| Year | Jan | Feb | Mar | Apr | May | Jun | Jul | Aug | Sep | Oct | Nov | Dec |
|---|---|---|---|---|---|---|---|---|---|---|---|---|
| 2007 | 4,588 | 4,144 | 4,588 | 4,440 | 4,588 | 4,440 | 4,588 | 4,588 | 4,440 | 4,588 | 4,440 | 4,588 |
| 2008 | 4,867 | 4,553 | 4,867 | 4,710 | 4,867 | 4,710 | 4,867 | 4,867 | 4,710 | 4,867 | 4,710 | 4,867 |
| 2009 | 5,146 | 4,648 | 5,146 | 4,980 | 5,146 | 4,980 | 5,146 | 5,146 | 4,980 | 5,146 | 4,980 | 5,146 |
| 2010 | 5,447 | 4,946 | 5,447 | 5,602 | 5,813 | 5,421 | 6,204 | 6,207 | 5,989 | 6,907 | 6,788 | 7,097 |
| 2011 | 6,815 | 5,986 | 7,359 | 6,875 | 7,130 | 6,835 | 8,707 | 8,723 | 8,422 | 8,954 | 8,564 | 8,702 |
| 2012 | 9,671 | 9,053 | 9,568 | 9,767 | 10,096 | 9,563 | 11,629 | 11,583 | 11,117 | 12,315 | 11,636 | 11,550 |
| 2013 | 11,434 | 11,079 | 12,424 | 13,942 | 14,143 | 13,819 | 15,349 | 15,460 | 14,639 | 15,966 | 14,817 | 14,887 |
| 2014 | 16,349 | 14,767 | 16,349 | 17,462 | 18,044 | 17,462 | 19,113 | 19,113 | 18,496 | 20,510 | 19,848 | 20,510 |
| 2015 | 17,292 | 17,568 | 20,997 | 22,002 | 23,656 | 22,457 | 22,381 | 24,555 | 24,319 | 24,780 | 23,797 | 20,801 |
| 2016 | 29,130 | 31,292 | 34,665 | 34,992 | 36,558 | 35,571 | 37,866 | 38,248 | 37,489 | 39,204 | 37,909 | 38,378 |
| 2017 | 39,658 | 37,741 | 43,421 | 42,335 | 45,703 | 43,200 | 45,916 | 46,147 | 47,880 | 51,848 | 50,268 | 52,515 |
| 2018 | 44,743 | 43,441 | 52,164 | 52,838 | 55,803 | 56,402 | 61,428 | 64,353 | 63,659 | 68,085 | 66,884 | 73,926 |
| 2019 | 76,202 | 71,247 | 82,141 | 81,441 | 85,329 | 82,328 | 86,861 | 91,305 | 91,086 | 94,680 | 93,876 | 98,496 |
| 2020 | 111,134 | 107,421 | 118,554 | 107,245 | 96,296 | 103,789 | 114,439 | 117,905 | 116,170 | 121,492 | 119,426 | 119,925 |
| 2021 | 123,831 | 100,344 | 130,645 | 130,412 | 137,156 | 136,084 | 145,709 | 148,203 | 144,422 | 150,999 | 147,913 | 152,573 |
| 2022 | 151,750 | 143,394 | 172,517 | 172,120 | 178,882 | 172,020 | 183,568 | 186,993 | 189,352 | 199,593 | 191,738 | 203,346 |
| 2023 | 207,457 | 188,753 | 221,151 | 214,856 | 218,599 | 203,545 | 217,332 | 220,613 | 216,336 | 221,623 | 224,966 | 242,274 |
| 2024 | 229,148 | 228,394 | 247,337 | 236,889 | 246,647 | 242,661 | 258,721 | 265,652 | 257,697 | 274,730 | 267,918 | 282,880 |
| 2025 | NA | NA | NA | NA | NA | NA | NA | NA | NA | NA | NA | NA |
| 2026 | NA | NA | NA | NA | ||||||||
| - = No Data Reported; -- = Not Applicable; NA = Not Available; W = Withheld to avoid disclosure of individual company data. |
| Release Date: 6/30/2026 |
| Next Release Date: 7/31/2026 |