|
Download Data (XLS File) |
|
||||||||
|
||||||||
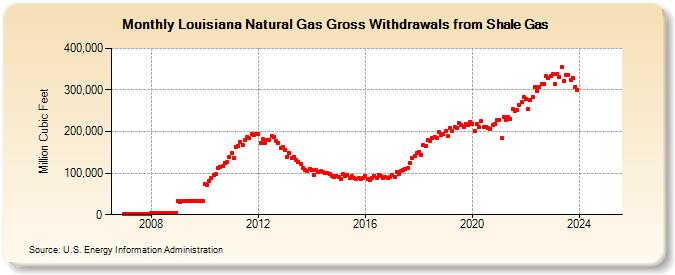
| Louisiana Natural Gas Gross Withdrawals from Shale Gas (Million Cubic Feet) | ||||||||
| Year | Jan | Feb | Mar | Apr | May | Jun | Jul | Aug | Sep | Oct | Nov | Dec |
|---|---|---|---|---|---|---|---|---|---|---|---|---|
| 2007 | 1,273 | 1,150 | 1,273 | 1,232 | 1,273 | 1,232 | 1,273 | 1,273 | 1,232 | 1,273 | 1,232 | 1,273 |
| 2008 | 3,176 | 2,971 | 3,176 | 3,074 | 3,176 | 3,074 | 3,176 | 3,176 | 3,074 | 3,176 | 3,074 | 3,176 |
| 2009 | 34,023 | 30,730 | 34,023 | 32,926 | 34,023 | 32,926 | 34,023 | 34,023 | 32,926 | 34,023 | 32,926 | 34,023 |
| 2010 | 73,613 | 70,314 | 81,781 | 89,175 | 95,142 | 97,298 | 113,266 | 115,820 | 116,140 | 124,531 | 127,202 | 138,397 |
| 2011 | 148,007 | 137,530 | 162,508 | 166,079 | 175,171 | 167,273 | 180,068 | 186,223 | 184,020 | 194,658 | 191,968 | 194,801 |
| 2012 | 194,119 | 171,761 | 182,244 | 172,498 | 180,224 | 179,723 | 189,656 | 187,076 | 177,102 | 173,301 | 160,979 | 161,869 |
| 2013 | 156,155 | 139,559 | 149,232 | 136,236 | 139,076 | 131,538 | 126,520 | 120,844 | 112,395 | 108,347 | 105,574 | 108,896 |
| 2014 | 106,821 | 96,483 | 106,821 | 102,255 | 105,663 | 102,255 | 100,520 | 100,520 | 97,278 | 93,965 | 90,934 | 93,965 |
| 2015 | 91,666 | 85,479 | 96,918 | 91,937 | 95,045 | 88,223 | 92,391 | 89,346 | 85,624 | 87,865 | 86,036 | 88,568 |
| 2016 | 93,687 | 85,031 | 84,636 | 88,212 | 92,235 | 88,460 | 96,077 | 92,233 | 87,551 | 90,841 | 88,641 | 91,684 |
| 2017 | 95,754 | 89,967 | 102,965 | 98,442 | 105,727 | 107,705 | 110,271 | 112,540 | 124,661 | 135,371 | 141,900 | 147,792 |
| 2018 | 150,138 | 144,130 | 167,244 | 164,908 | 180,163 | 177,761 | 185,568 | 187,685 | 184,272 | 198,022 | 191,331 | 195,153 |
| 2019 | 200,541 | 188,251 | 209,666 | 200,420 | 210,206 | 209,735 | 220,499 | 216,326 | 210,152 | 219,197 | 215,966 | 224,047 |
| 2020 | 217,130 | 201,825 | 217,824 | 210,032 | 224,964 | 211,938 | 212,072 | 208,856 | 206,864 | 215,520 | 217,970 | 227,449 |
| 2021 | 228,613 | 184,066 | 234,411 | 227,877 | 236,140 | 231,274 | 254,117 | 249,727 | 252,184 | 264,895 | 269,985 | 282,635 |
| 2022 | 277,377 | 253,206 | 276,310 | 281,975 | 306,104 | 297,410 | 307,566 | 315,450 | 313,389 | 332,842 | 328,462 | 334,262 |
| 2023 | 337,560 | 314,914 | 338,444 | 331,457 | 355,884 | 321,537 | 337,076 | 336,817 | 323,729 | 329,526 | 313,698 | 311,469 |
| 2024 | 308,771 | 298,119 | 300,336 | 269,643 | 262,695 | 252,199 | 273,279 | 267,029 | 245,687 | 255,840 | 245,469 | 253,591 |
| 2025 | NA | NA | NA | NA | NA | NA | NA | NA | NA | NA | NA | NA |
| 2026 | NA | NA | NA | NA | ||||||||
| - = No Data Reported; -- = Not Applicable; NA = Not Available; W = Withheld to avoid disclosure of individual company data. |
| Release Date: 6/30/2026 |
| Next Release Date: 7/31/2026 |