|
Download Data (XLS File) |
|
||||||||
|
||||||||
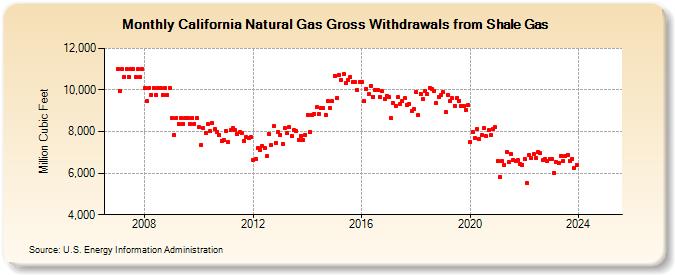
| California Natural Gas Gross Withdrawals from Shale Gas (Million Cubic Feet) | ||||||||
| Year | Jan | Feb | Mar | Apr | May | Jun | Jul | Aug | Sep | Oct | Nov | Dec |
|---|---|---|---|---|---|---|---|---|---|---|---|---|
| 2007 | 10,998 | 9,933 | 10,998 | 10,643 | 10,998 | 10,643 | 10,998 | 10,998 | 10,643 | 10,998 | 10,643 | 10,998 |
| 2008 | 10,097 | 9,446 | 10,097 | 9,772 | 10,097 | 9,772 | 10,097 | 10,097 | 9,772 | 10,097 | 9,772 | 10,097 |
| 2009 | 8,665 | 7,827 | 8,665 | 8,386 | 8,665 | 8,386 | 8,665 | 8,665 | 8,386 | 8,665 | 8,386 | 8,665 |
| 2010 | 8,201 | 7,365 | 8,149 | 7,952 | 8,353 | 8,008 | 8,398 | 8,108 | 7,970 | 7,829 | 7,561 | 7,612 |
| 2011 | 8,049 | 7,489 | 8,071 | 8,160 | 8,075 | 7,881 | 7,969 | 7,945 | 7,553 | 7,732 | 7,705 | 7,721 |
| 2012 | 6,637 | 6,670 | 7,193 | 7,110 | 7,298 | 7,210 | 6,809 | 7,873 | 7,357 | 8,252 | 7,464 | 7,980 |
| 2013 | 7,850 | 7,425 | 8,149 | 7,924 | 8,195 | 7,798 | 8,053 | 8,029 | 7,617 | 7,765 | 7,605 | 7,857 |
| 2014 | 8,816 | 7,963 | 8,816 | 8,866 | 9,162 | 8,866 | 9,109 | 9,109 | 8,815 | 9,453 | 9,148 | 9,453 |
| 2015 | 10,696 | 9,603 | 10,730 | 10,475 | 10,762 | 10,328 | 10,467 | 10,608 | 10,390 | 10,364 | 10,002 | 10,397 |
| 2016 | 10,402 | 9,469 | 10,048 | 9,828 | 10,179 | 9,678 | 9,997 | 9,984 | 9,672 | 9,935 | 9,581 | 9,725 |
| 2017 | 9,677 | 8,649 | 9,367 | 9,249 | 9,638 | 9,331 | 9,458 | 9,595 | 9,281 | 9,339 | 8,978 | 9,098 |
| 2018 | 9,886 | 8,792 | 9,795 | 9,547 | 9,932 | 9,794 | 10,108 | 10,051 | 9,973 | 9,372 | 9,670 | 9,751 |
| 2019 | 9,887 | 8,931 | 9,774 | 9,454 | 9,598 | 9,249 | 9,621 | 9,484 | 9,219 | 9,213 | 9,034 | 9,257 |
| 2020 | 7,506 | 7,982 | 7,673 | 8,103 | 7,645 | 7,827 | 8,154 | 7,773 | 8,058 | 7,830 | 8,133 | 8,208 |
| 2021 | 6,574 | 5,822 | 6,560 | 6,384 | 7,026 | 6,517 | 6,910 | 6,654 | 6,576 | 6,619 | 6,452 | 6,409 |
| 2022 | 6,680 | 5,507 | 6,864 | 6,711 | 6,911 | 6,713 | 6,995 | 6,945 | 6,612 | 6,677 | 6,593 | 6,685 |
| 2023 | 6,675 | 6,030 | 6,553 | 6,504 | 6,827 | 6,563 | 6,829 | 6,882 | 6,600 | 7,360 | 6,244 | 6,385 |
| 2024 | 6,409 | 5,967 | 6,408 | 6,205 | 6,397 | 6,235 | 6,526 | 6,424 | 6,110 | 6,401 | 6,087 | 5,981 |
| 2025 | NA | NA | NA | NA | NA | NA | NA | NA | NA | NA | NA | NA |
| 2026 | NA | NA | NA | NA | ||||||||
| - = No Data Reported; -- = Not Applicable; NA = Not Available; W = Withheld to avoid disclosure of individual company data. |
| Release Date: 6/30/2026 |
| Next Release Date: 7/31/2026 |