|
Download Data (XLS File) |
|
||||||||
|
||||||||
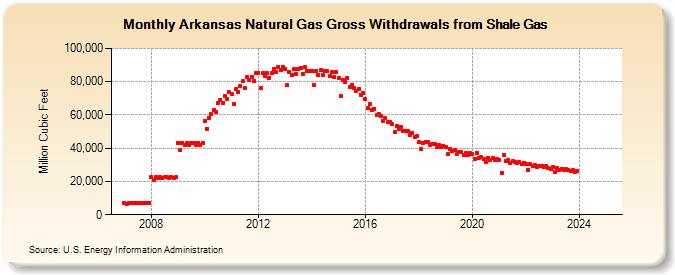
| Arkansas Natural Gas Gross Withdrawals from Shale Gas (Million Cubic Feet) | ||||||||
| Year | Jan | Feb | Mar | Apr | May | Jun | Jul | Aug | Sep | Oct | Nov | Dec |
|---|---|---|---|---|---|---|---|---|---|---|---|---|
| 2007 | 7,138 | 6,448 | 7,138 | 6,908 | 7,138 | 6,908 | 7,138 | 7,138 | 6,908 | 7,138 | 6,908 | 7,138 |
| 2008 | 22,507 | 21,055 | 22,507 | 21,781 | 22,507 | 21,781 | 22,507 | 22,507 | 21,781 | 22,507 | 21,781 | 22,507 |
| 2009 | 43,362 | 39,166 | 43,362 | 41,963 | 43,362 | 41,963 | 43,362 | 43,362 | 41,963 | 43,362 | 41,963 | 43,362 |
| 2010 | 56,513 | 51,742 | 58,441 | 60,346 | 62,876 | 61,998 | 67,015 | 69,033 | 67,447 | 71,380 | 69,328 | 73,561 |
| 2011 | 72,843 | 66,715 | 75,333 | 74,018 | 77,112 | 80,345 | 76,142 | 82,874 | 80,977 | 82,901 | 80,530 | 85,447 |
| 2012 | 85,470 | 76,387 | 85,462 | 83,173 | 85,092 | 82,434 | 85,357 | 87,678 | 85,620 | 89,050 | 86,786 | 88,975 |
| 2013 | 87,772 | 77,706 | 85,510 | 83,884 | 87,431 | 84,530 | 87,409 | 88,130 | 84,866 | 89,022 | 86,129 | 86,706 |
| 2014 | 86,449 | 78,083 | 86,449 | 84,018 | 86,819 | 84,018 | 86,156 | 86,156 | 83,377 | 85,617 | 82,855 | 85,617 |
| 2015 | 82,282 | 71,210 | 81,279 | 79,975 | 82,003 | 77,028 | 78,046 | 76,328 | 74,147 | 75,563 | 72,173 | 73,254 |
| 2016 | 69,277 | 63,995 | 66,355 | 63,046 | 63,821 | 59,681 | 60,357 | 59,276 | 56,621 | 58,103 | 55,731 | 55,761 |
| 2017 | 54,428 | 49,476 | 53,562 | 51,572 | 52,696 | 50,228 | 50,575 | 50,208 | 47,772 | 48,868 | 46,824 | 47,141 |
| 2018 | 43,640 | 39,350 | 43,129 | 43,672 | 43,817 | 41,823 | 42,330 | 42,496 | 40,862 | 42,163 | 40,581 | 41,442 |
| 2019 | 40,798 | 36,207 | 39,667 | 38,189 | 38,657 | 36,238 | 37,901 | 37,602 | 36,031 | 37,105 | 35,972 | 36,915 |
| 2020 | 36,366 | 33,489 | 37,308 | 34,148 | 34,731 | 33,223 | 31,563 | 34,319 | 32,984 | 34,228 | 32,819 | 33,530 |
| 2021 | 32,713 | 25,090 | 36,066 | 32,041 | 32,685 | 31,251 | 32,221 | 31,974 | 30,897 | 31,790 | 30,530 | 31,152 |
| 2022 | 30,334 | 27,119 | 30,408 | 29,335 | 29,954 | 28,706 | 29,415 | 29,513 | 28,515 | 29,280 | 27,998 | 27,540 |
| 2023 | 28,775 | 25,676 | 28,384 | 27,084 | 27,753 | 26,588 | 27,221 | 27,091 | 26,203 | 26,894 | 25,850 | 26,036 |
| 2024 | 23,684 | 24,251 | 25,857 | 24,633 | 25,241 | 24,065 | 25,007 | 24,957 | 24,043 | 24,594 | 23,777 | 23,648 |
| 2025 | NA | NA | NA | NA | NA | NA | NA | NA | NA | NA | NA | NA |
| 2026 | NA | NA | NA | NA | ||||||||
| - = No Data Reported; -- = Not Applicable; NA = Not Available; W = Withheld to avoid disclosure of individual company data. |
| Release Date: 6/30/2026 |
| Next Release Date: 7/31/2026 |