|
Download Data (XLS File) |
|
||||||||
|
||||||||
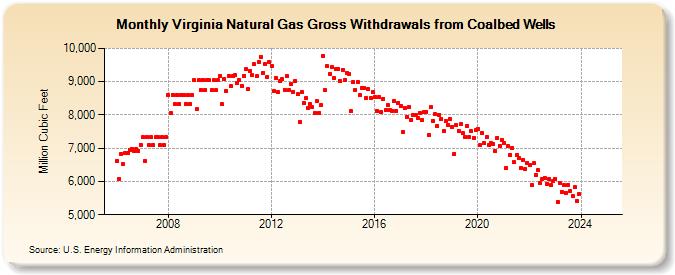
| Virginia Natural Gas Gross Withdrawals from Coalbed Wells (Million Cubic Feet) | ||||||||
| Year | Jan | Feb | Mar | Apr | May | Jun | Jul | Aug | Sep | Oct | Nov | Dec |
|---|---|---|---|---|---|---|---|---|---|---|---|---|
| 2006 | 6,618 | 6,083 | 6,839 | 6,513 | 6,862 | 6,862 | 6,936 | 6,987 | 6,922 | 6,970 | 6,927 | 7,107 |
| 2007 | 7,327 | 6,618 | 7,327 | 7,091 | 7,327 | 7,091 | 7,327 | 7,327 | 7,091 | 7,327 | 7,091 | 7,327 |
| 2008 | 8,603 | 8,048 | 8,603 | 8,325 | 8,603 | 8,325 | 8,603 | 8,603 | 8,325 | 8,603 | 8,325 | 8,603 |
| 2009 | 9,037 | 8,163 | 9,037 | 8,746 | 9,037 | 8,746 | 9,037 | 9,037 | 8,746 | 9,037 | 8,746 | 9,037 |
| 2010 | 9,166 | 8,314 | 9,076 | 8,726 | 9,157 | 8,865 | 9,166 | 9,188 | 8,974 | 9,047 | 8,882 | 9,175 |
| 2011 | 9,367 | 8,771 | 9,326 | 9,200 | 9,522 | 9,162 | 9,602 | 9,755 | 9,275 | 9,519 | 9,137 | 9,583 |
| 2012 | 9,481 | 8,718 | 9,114 | 8,687 | 9,018 | 9,067 | 8,757 | 9,170 | 8,740 | 8,916 | 8,694 | 9,021 |
| 2013 | 8,617 | 7,797 | 8,695 | 8,348 | 8,506 | 8,220 | 8,320 | 8,236 | 8,044 | 8,407 | 8,058 | 8,295 |
| 2014 | 9,773 | 8,737 | 9,461 | 9,234 | 9,440 | 9,111 | 9,374 | 9,370 | 9,016 | 9,362 | 9,044 | 9,275 |
| 2015 | 9,233 | 8,109 | 8,985 | 8,749 | 8,981 | 8,590 | 8,816 | 8,822 | 8,505 | 8,771 | 8,494 | 8,685 |
| 2016 | 8,540 | 8,116 | 8,548 | 8,093 | 8,481 | 8,143 | 8,300 | 8,146 | 8,130 | 8,416 | 8,132 | 8,368 |
| 2017 | 8,278 | 7,481 | 8,213 | 7,952 | 8,231 | 7,861 | 7,985 | 8,004 | 7,907 | 8,064 | 7,848 | 8,084 |
| 2018 | 8,091 | 7,400 | 8,230 | 7,830 | 8,016 | 7,668 | 8,007 | 7,880 | 7,523 | 7,820 | 7,702 | 7,876 |
| 2019 | 7,649 | 6,838 | 7,682 | 7,519 | 7,716 | 7,448 | 7,345 | 7,674 | 7,337 | 7,507 | 7,310 | 7,534 |
| 2020 | 7,590 | 7,084 | 7,464 | 7,146 | 7,337 | 7,097 | 7,157 | 7,125 | 6,918 | 7,308 | 7,073 | 7,246 |
| 2021 | 7,158 | 6,413 | 7,065 | 6,797 | 7,013 | 6,574 | 6,793 | 6,708 | 6,419 | 6,653 | 6,371 | 6,558 |
| 2022 | 6,500 | 5,894 | 6,542 | 6,198 | 6,335 | 5,960 | 6,078 | 6,109 | 5,933 | 6,076 | 5,880 | 6,014 |
| 2023 | 6,073 | 5,396 | 5,966 | 5,700 | 5,896 | 5,668 | 5,906 | 5,702 | 5,570 | 5,826 | 5,432 | 5,636 |
| 2024 | 5,616 | 5,235 | 5,645 | 5,517 | 5,652 | 5,448 | 5,590 | 5,611 | 5,319 | 5,496 | 5,389 | 5,511 |
| 2025 | NA | NA | NA | NA | NA | NA | NA | NA | NA | NA | NA | NA |
| 2026 | NA | NA | NA | NA | ||||||||
| - = No Data Reported; -- = Not Applicable; NA = Not Available; W = Withheld to avoid disclosure of individual company data. |
| Release Date: 6/30/2026 |
| Next Release Date: 7/31/2026 |