|
Download Data (XLS File) |
|
||||||||
|
||||||||
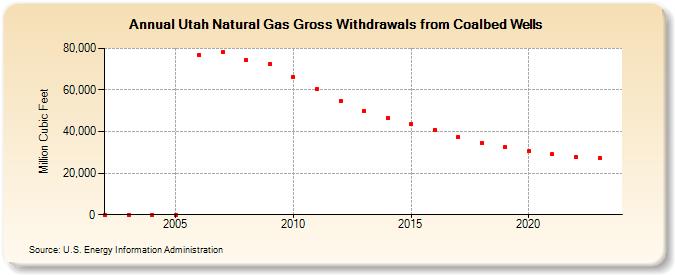
| Utah Natural Gas Gross Withdrawals from Coalbed Wells (Million Cubic Feet) | ||||||||
| Decade | Year-0 | Year-1 | Year-2 | Year-3 | Year-4 | Year-5 | Year-6 | Year-7 | Year-8 | Year-9 |
|---|---|---|---|---|---|---|---|---|---|---|
| 2000's | 0 | 0 | 0 | 0 | 76,705 | 78,367 | 74,399 | 72,492 | ||
| 2010's | 66,223 | 60,392 | 54,722 | 49,918 | 46,680 | 43,730 | 40,973 | 37,408 | 34,710 | 32,335 |
| 2020's | 30,444 | 29,040 | 27,563 | 27,285 | 26,036 |
| - = No Data Reported; -- = Not Applicable; NA = Not Available; W = Withheld to avoid disclosure of individual company data. |
| Release Date: 6/30/2026 |
| Next Release Date: 7/31/2026 |