|
Download Data (XLS File) |
|
||||||||
|
||||||||
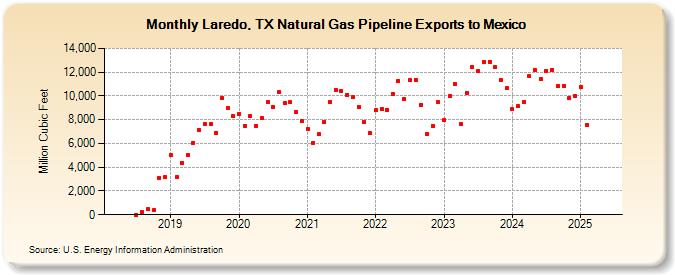
| Laredo, TX Natural Gas Pipeline Exports to Mexico (Million Cubic Feet) | ||||||||
| Year | Jan | Feb | Mar | Apr | May | Jun | Jul | Aug | Sep | Oct | Nov | Dec |
|---|---|---|---|---|---|---|---|---|---|---|---|---|
| 2018 | 17 | 245 | 458 | 386 | 3,116 | 3,182 | ||||||
| 2019 | 5,001 | 3,169 | 4,386 | 5,049 | 6,054 | 7,151 | 7,665 | 7,619 | 6,894 | 9,852 | 8,947 | 8,308 |
| 2020 | 8,510 | 7,507 | 8,302 | 7,490 | 8,153 | 9,492 | 9,046 | 10,350 | 9,378 | 9,447 | 8,659 | 7,922 |
| 2021 | 7,226 | 6,043 | 6,771 | 7,829 | 9,527 | 10,520 | 10,401 | 10,099 | 9,900 | 9,104 | 7,793 | 6,844 |
| 2022 | 8,781 | 8,881 | 8,840 | 10,183 | 11,282 | 9,760 | 11,331 | 11,368 | 9,275 | 6,782 | 7,494 | 9,474 |
| 2023 | 7,978 | 10,011 | 10,997 | 7,675 | 10,225 | 12,397 | 12,072 | 12,884 | 12,891 | 12,421 | 11,364 | 10,632 |
| 2024 | 8,857 | 9,130 | 9,487 | 11,693 | 12,162 | 11,394 | 12,105 | 12,221 | 10,828 | 10,841 | 9,820 | 9,971 |
| 2025 | 10,782 | 7,587 | 10,299 | 10,714 | 12,776 | 11,514 | 10,413 | 10,898 | 10,750 | 10,372 | 9,771 | 10,067 |
| 2026 | 8,194 | 7,808 | 7,481 | 9,094 | ||||||||
| - = No Data Reported; -- = Not Applicable; NA = Not Available; W = Withheld to avoid disclosure of individual company data. |
| Release Date: 6/30/2026 |
| Next Release Date: 7/31/2026 |