|
Download Data (XLS File) |
|
||||||||
|
||||||||
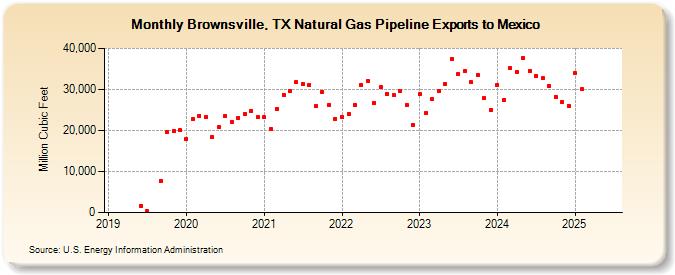
| Brownsville, TX Natural Gas Pipeline Exports to Mexico (Million Cubic Feet) | ||||||||
| Year | Jan | Feb | Mar | Apr | May | Jun | Jul | Aug | Sep | Oct | Nov | Dec |
|---|---|---|---|---|---|---|---|---|---|---|---|---|
| 2019 | 1,682 | 304 | 7,697 | 19,695 | 19,880 | 20,064 | ||||||
| 2020 | 17,881 | 22,797 | 23,602 | 23,327 | 18,453 | 20,771 | 23,416 | 22,170 | 23,110 | 23,976 | 24,772 | 23,254 |
| 2021 | 23,182 | 20,381 | 25,314 | 28,715 | 29,513 | 31,775 | 31,350 | 31,197 | 25,869 | 29,460 | 26,302 | 22,887 |
| 2022 | 23,397 | 24,071 | 26,224 | 31,176 | 32,090 | 26,775 | 30,496 | 28,888 | 28,560 | 29,604 | 26,280 | 21,409 |
| 2023 | 28,947 | 24,217 | 27,594 | 29,643 | 31,307 | 37,478 | 33,820 | 34,490 | 31,747 | 33,563 | 27,826 | 25,032 |
| 2024 | 31,074 | 27,479 | 35,191 | 34,359 | 37,670 | 34,537 | 33,299 | 32,698 | 30,931 | 28,261 | 26,932 | 26,074 |
| 2025 | 33,947 | 30,011 | 28,403 | 36,690 | 38,637 | 34,627 | 32,237 | 37,068 | 28,596 | 25,268 | 27,183 | 23,403 |
| 2026 | 26,629 | 24,939 | 25,849 | 26,299 | ||||||||
| - = No Data Reported; -- = Not Applicable; NA = Not Available; W = Withheld to avoid disclosure of individual company data. |
| Release Date: 6/30/2026 |
| Next Release Date: 7/31/2026 |