|
Download Data (XLS File) |
|
||||||||
|
||||||||
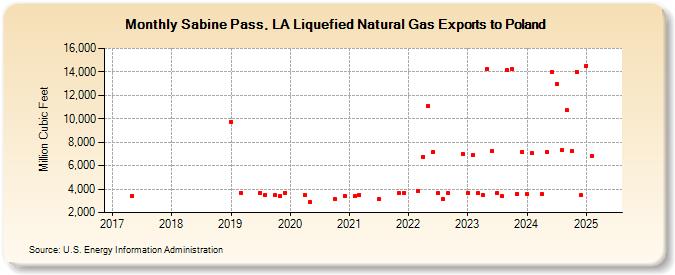
| Sabine Pass, LA Liquefied Natural Gas Exports to Poland (Million Cubic Feet) | ||||||||
| Year | Jan | Feb | Mar | Apr | May | Jun | Jul | Aug | Sep | Oct | Nov | Dec |
|---|---|---|---|---|---|---|---|---|---|---|---|---|
| 2017 | 3,440 | |||||||||||
| 2019 | 9,762 | 3,701 | 3,694 | 3,537 | 3,489 | 3,432 | 3,683 | |||||
| 2020 | 3,523 | 2,897 | 3,157 | 3,430 | ||||||||
| 2021 | 3,387 | 3,507 | 3,123 | 3,640 | 3,690 | |||||||
| 2022 | 3,831 | 6,767 | 11,106 | 7,185 | 3,659 | 3,116 | 3,650 | 7,000 | ||||
| 2023 | 3,703 | 6,930 | 3,663 | 3,536 | 14,215 | 7,247 | 3,635 | 3,378 | 14,121 | 14,213 | 3,620 | 7,201 |
| 2024 | 3,579 | 7,056 | 3,576 | 7,165 | 13,996 | 12,956 | 7,324 | 10,733 | 7,263 | 14,011 | 3,473 | |
| 2025 | 14,522 | 6,862 | 18,093 | 14,642 | 3,511 | 3,567 | 6,841 | 7,573 | 3,681 | 11,330 | 3,550 | |
| 2026 | 8,065 | 7,781 | 7,356 | |||||||||
| - = No Data Reported; -- = Not Applicable; NA = Not Available; W = Withheld to avoid disclosure of individual company data. |
| Release Date: 6/30/2026 |
| Next Release Date: 7/31/2026 |