|
Download Data (XLS File) |
|
||||||||
|
||||||||
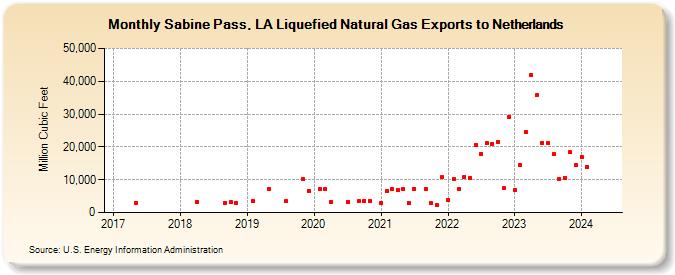
| Sabine Pass, LA Liquefied Natural Gas Exports to Netherlands (Million Cubic Feet) | ||||||||
| Year | Jan | Feb | Mar | Apr | May | Jun | Jul | Aug | Sep | Oct | Nov | Dec |
|---|---|---|---|---|---|---|---|---|---|---|---|---|
| 2017 | 3,042 | |||||||||||
| 2018 | 3,253 | 2,915 | 3,071 | 2,949 | ||||||||
| 2019 | 3,390 | 7,269 | 3,386 | 10,099 | 6,645 | |||||||
| 2020 | 7,106 | 7,030 | 3,244 | 3,258 | 3,440 | 3,603 | 3,481 | |||||
| 2021 | 2,949 | 6,627 | 7,216 | 6,796 | 7,040 | 3,030 | 7,211 | 7,136 | 2,933 | 2,274 | 10,899 | |
| 2022 | 3,693 | 10,194 | 7,176 | 10,924 | 10,596 | 20,708 | 17,931 | 21,112 | 20,946 | 21,584 | 7,338 | 29,051 |
| 2023 | 7,011 | 14,361 | 24,631 | 42,045 | 35,693 | 21,235 | 21,035 | 17,909 | 10,232 | 10,597 | 18,341 | 14,390 |
| 2024 | 16,998 | 13,853 | 21,375 | 24,613 | 17,794 | 2,944 | 9,720 | 17,066 | 18,082 | 9,693 | 10,919 | 10,521 |
| 2025 | 7,415 | 7,055 | 27,491 | 17,734 | 24,856 | 13,887 | 17,730 | 24,073 | 14,620 | 15,769 | 6,976 | 3,688 |
| 2026 | 11,131 | 13,908 | 17,999 | 11,083 | ||||||||
| - = No Data Reported; -- = Not Applicable; NA = Not Available; W = Withheld to avoid disclosure of individual company data. |
| Release Date: 6/30/2026 |
| Next Release Date: 7/31/2026 |