|
Download Data (XLS File) |
|
||||||||
|
||||||||
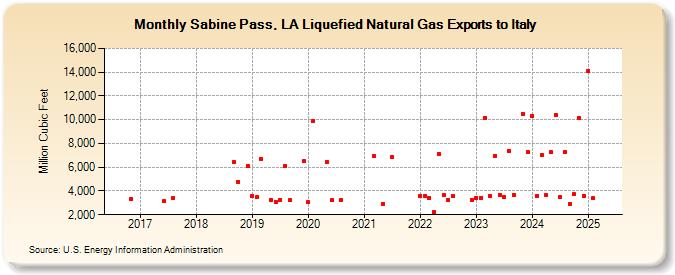
| Sabine Pass, LA Liquefied Natural Gas Exports to Italy (Million Cubic Feet) | ||||||||
| Year | Jan | Feb | Mar | Apr | May | Jun | Jul | Aug | Sep | Oct | Nov | Dec |
|---|---|---|---|---|---|---|---|---|---|---|---|---|
| 2016 | 3,328 | |||||||||||
| 2017 | 3,120 | 3,372 | ||||||||||
| 2018 | 6,468 | 4,785 | 6,137 | |||||||||
| 2019 | 3,585 | 3,454 | 6,684 | 3,253 | 3,072 | 3,249 | 6,082 | 3,230 | 6,510 | |||
| 2020 | 3,034 | 9,925 | 6,452 | 3,202 | 3,277 | |||||||
| 2021 | 6,904 | 2,923 | 6,826 | |||||||||
| 2022 | 3,605 | 3,580 | 3,387 | 2,211 | 7,129 | 3,674 | 3,277 | 3,589 | 3,280 | |||
| 2023 | 3,428 | 3,434 | 10,181 | 3,600 | 6,971 | 3,671 | 3,489 | 7,374 | 3,687 | 10,511 | 7,249 | |
| 2024 | 10,338 | 3,603 | 7,050 | 3,691 | 7,242 | 10,432 | 3,463 | 7,284 | 2,920 | 3,711 | 10,131 | 3,607 |
| 2025 | 14,124 | 3,381 | 3,513 | 3,287 | 3,466 | 3,280 | 6,831 | 7,195 | 3,627 | 3,691 | 3,338 | |
| 2026 | 14,335 | 3,636 | 14,637 | 16,969 | ||||||||
| - = No Data Reported; -- = Not Applicable; NA = Not Available; W = Withheld to avoid disclosure of individual company data. |
| Release Date: 6/30/2026 |
| Next Release Date: 7/31/2026 |