|
Download Data (XLS File) |
|
||||||||
|
||||||||
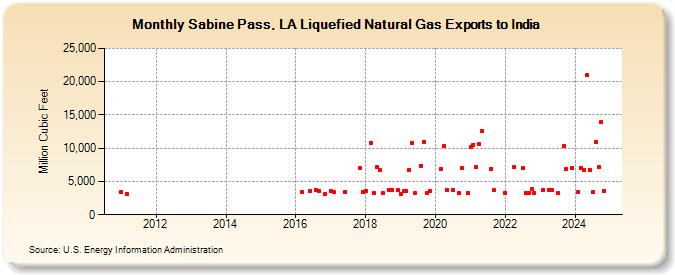
| Sabine Pass, LA Liquefied Natural Gas Exports to India (Million Cubic Feet) | ||||||||
| Year | Jan | Feb | Mar | Apr | May | Jun | Jul | Aug | Sep | Oct | Nov | Dec |
|---|---|---|---|---|---|---|---|---|---|---|---|---|
| 2011 | 3,477 | 3,072 | ||||||||||
| 2016 | 3,390 | 3,617 | 3,701 | 3,639 | 3,115 | |||||||
| 2017 | 3,623 | 3,399 | 3,413 | 7,057 | 3,427 | |||||||
| 2018 | 3,596 | 10,834 | 3,254 | 7,118 | 6,717 | 3,218 | 3,667 | 3,719 | 3,718 | |||
| 2019 | 3,188 | 3,559 | 3,634 | 6,742 | 10,730 | 3,215 | 7,294 | 10,968 | 3,249 | 3,593 | ||
| 2020 | 6,944 | 10,337 | 3,677 | 3,663 | 3,277 | 7,027 | 3,312 | |||||
| 2021 | 10,189 | 10,516 | 7,186 | 10,604 | 12,643 | 6,929 | 3,659 | |||||
| 2022 | 3,288 | 7,118 | 7,062 | 3,286 | 3,274 | 3,836 | 3,308 | |||||
| 2023 | 3,686 | 3,678 | 3,681 | 3,285 | 10,301 | 6,812 | 7,035 | |||||
| 2024 | 3,384 | 7,065 | 6,773 | 20,972 | 6,761 | 3,373 | 10,938 | 7,193 | 13,951 | 3,551 | ||
| 2025 | 3,678 | 3,672 | 3,393 | 3,655 | ||||||||
| 2026 | 3,648 | 10,952 | ||||||||||
| - = No Data Reported; -- = Not Applicable; NA = Not Available; W = Withheld to avoid disclosure of individual company data. |
| Release Date: 6/30/2026 |
| Next Release Date: 7/31/2026 |