|
Download Data (XLS File) |
|
||||||||
|
||||||||
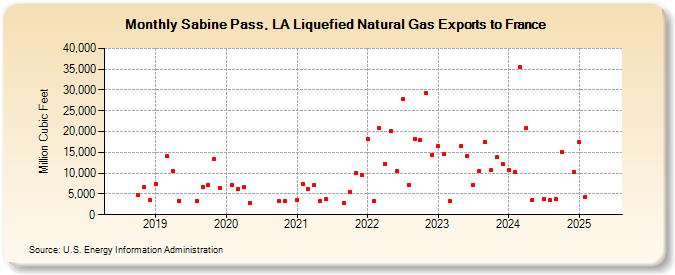
| Sabine Pass, LA Liquefied Natural Gas Exports to France (Million Cubic Feet) | ||||||||
| Year | Jan | Feb | Mar | Apr | May | Jun | Jul | Aug | Sep | Oct | Nov | Dec |
|---|---|---|---|---|---|---|---|---|---|---|---|---|
| 2018 | 4,846 | 6,611 | 3,453 | |||||||||
| 2019 | 7,303 | 14,048 | 10,400 | 3,411 | 3,249 | 6,740 | 7,183 | 13,347 | 6,479 | |||
| 2020 | 7,194 | 6,293 | 6,552 | 2,903 | 3,340 | 3,390 | ||||||
| 2021 | 3,587 | 7,355 | 6,212 | 7,186 | 3,267 | 3,683 | 2,893 | 5,523 | 10,021 | 9,545 | ||
| 2022 | 18,248 | 3,285 | 20,959 | 12,243 | 20,136 | 10,476 | 27,718 | 7,205 | 18,326 | 17,953 | 29,284 | 14,421 |
| 2023 | 16,516 | 14,506 | 3,291 | 16,625 | 14,175 | 7,190 | 10,600 | 17,515 | 10,683 | 13,812 | 12,117 | |
| 2024 | 10,698 | 10,313 | 35,597 | 20,865 | 3,609 | 3,668 | 3,460 | 3,676 | 15,077 | 10,285 | ||
| 2025 | 17,394 | 4,269 | 10,192 | 10,736 | 14,223 | 3,685 | 7,056 | 11,018 | 10,578 | 14,454 | 7,163 | |
| 2026 | 10,779 | 3,683 | 17,934 | 3,570 | ||||||||
| - = No Data Reported; -- = Not Applicable; NA = Not Available; W = Withheld to avoid disclosure of individual company data. |
| Release Date: 6/30/2026 |
| Next Release Date: 7/31/2026 |