|
Download Data (XLS File) |
|
||||||||
|
||||||||
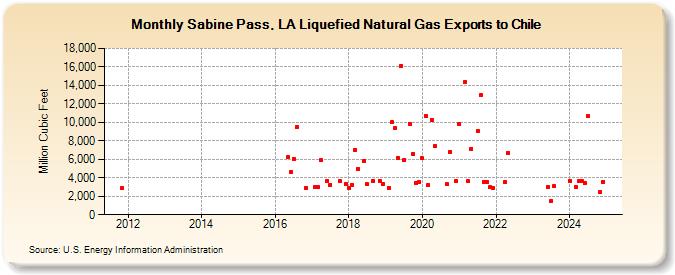
| Sabine Pass, LA Liquefied Natural Gas Exports to Chile (Million Cubic Feet) | ||||||||
| Year | Jan | Feb | Mar | Apr | May | Jun | Jul | Aug | Sep | Oct | Nov | Dec |
|---|---|---|---|---|---|---|---|---|---|---|---|---|
| 2011 | 2,910 | |||||||||||
| 2016 | 6,230 | 4,643 | 6,074 | 9,518 | 2,940 | |||||||
| 2017 | 2,950 | 2,951 | 5,894 | 3,657 | 3,256 | 3,675 | 3,362 | |||||
| 2018 | 2,938 | 3,249 | 6,994 | 4,987 | 5,865 | 3,276 | 3,675 | 3,676 | 3,276 | |||
| 2019 | 2,933 | 10,005 | 9,429 | 6,188 | 16,095 | 5,937 | 9,811 | 6,608 | 3,484 | 3,572 | ||
| 2020 | 6,087 | 10,731 | 3,216 | 10,295 | 7,397 | 3,277 | 6,836 | 3,688 | ||||
| 2021 | 9,784 | 14,373 | 3,599 | 7,149 | 9,108 | 12,935 | 3,580 | 3,589 | 2,956 | 2,938 | ||
| 2022 | 3,530 | 6,723 | ||||||||||
| 2023 | 3,031 | 1,495 | 3,065 | |||||||||
| 2024 | 3,696 | 3,027 | 3,613 | 3,603 | 3,401 | 10,640 | 2,434 | 3,560 | ||||
| 2025 | 3,421 | 7,196 | 3,451 | |||||||||
| - = No Data Reported; -- = Not Applicable; NA = Not Available; W = Withheld to avoid disclosure of individual company data. |
| Release Date: 6/30/2026 |
| Next Release Date: 7/31/2026 |