|
Download Data (XLS File) |
|
||||||||
|
||||||||
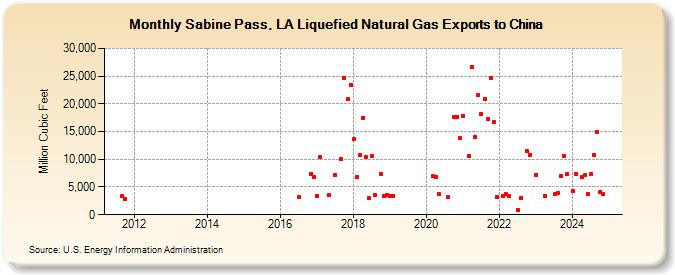
| Sabine Pass, LA Liquefied Natural Gas Exports to China (Million Cubic Feet) | ||||||||
| Year | Jan | Feb | Mar | Apr | May | Jun | Jul | Aug | Sep | Oct | Nov | Dec |
|---|---|---|---|---|---|---|---|---|---|---|---|---|
| 2011 | 3,354 | 2,848 | ||||||||||
| 2016 | 3,132 | 7,341 | 6,747 | |||||||||
| 2017 | 3,391 | 10,338 | 3,514 | 7,218 | 10,056 | 24,588 | 20,871 | 23,433 | ||||
| 2018 | 13,584 | 6,750 | 10,739 | 17,509 | 10,416 | 2,926 | 10,644 | 3,588 | 7,269 | 3,451 | 3,598 | |
| 2019 | 3,387 | 3,464 | ||||||||||
| 2020 | 6,897 | 6,815 | 3,660 | 3,274 | 17,693 | 17,682 | 13,909 | |||||
| 2021 | 17,842 | 10,597 | 26,567 | 13,937 | 21,652 | 18,243 | 20,874 | 17,261 | 24,651 | 16,713 | 3,284 | |
| 2022 | 3,357 | 3,709 | 3,384 | 784 | 2,993 | 11,478 | 10,791 | |||||
| 2023 | 7,213 | 3,426 | 3,663 | 3,986 | 6,962 | 10,632 | 7,283 | |||||
| 2024 | 4,242 | 7,409 | 6,760 | 7,086 | 3,681 | 7,304 | 10,845 | 14,991 | 4,179 | 3,671 | ||
| - = No Data Reported; -- = Not Applicable; NA = Not Available; W = Withheld to avoid disclosure of individual company data. |
| Release Date: 6/30/2026 |
| Next Release Date: 7/31/2026 |