|
Download Data (XLS File) |
|
||||||||
|
||||||||
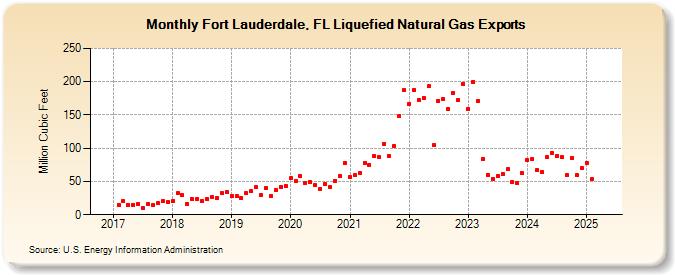
| Fort Lauderdale, FL Liquefied Natural Gas Exports (Million Cubic Feet) | ||||||||
| Year | Jan | Feb | Mar | Apr | May | Jun | Jul | Aug | Sep | Oct | Nov | Dec |
|---|---|---|---|---|---|---|---|---|---|---|---|---|
| 2017 | 15 | 20 | 15 | 15 | 16 | 10 | 16 | 14 | 17 | 20 | 19 | |
| 2018 | 20 | 32 | 29 | 16 | 24 | 24 | 21 | 23 | 26 | 25 | 33 | 34 |
| 2019 | 28 | 28 | 25 | 32 | 35 | 41 | 30 | 40 | 28 | 37 | 42 | 43 |
| 2020 | 55 | 50 | 58 | 47 | 49 | 44 | 39 | 46 | 42 | 51 | 58 | 78 |
| 2021 | 57 | 59 | 63 | 78 | 75 | 88 | 86 | 107 | 89 | 103 | 148 | 187 |
| 2022 | 167 | 187 | 173 | 176 | 193 | 105 | 171 | 174 | 159 | 183 | 173 | 197 |
| 2023 | 159 | 200 | 171 | 84 | 60 | 54 | 58 | 61 | 68 | 49 | 47 | 62 |
| 2024 | 82 | 84 | 67 | 64 | 86 | 93 | 89 | 86 | 59 | 85 | 59 | 70 |
| 2025 | 78 | 53 | 113 | 95 | 87 | 96 | 126 | 103 | 88 | 77 | 109 | 111 |
| 2026 | 124 | 103 | 115 | 120 | ||||||||
| - = No Data Reported; -- = Not Applicable; NA = Not Available; W = Withheld to avoid disclosure of individual company data. |
| Release Date: 6/30/2026 |
| Next Release Date: 7/31/2026 |