|
Download Data (XLS File) |
|
||||||||
|
||||||||
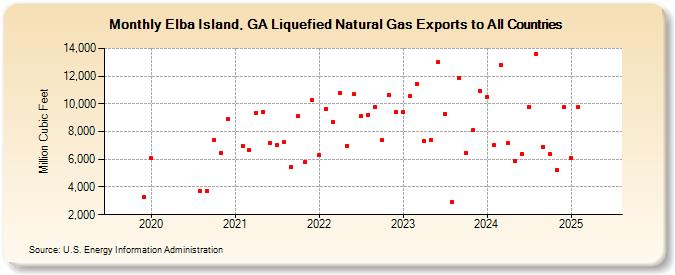
| Elba Island, GA Liquefied Natural Gas Exports to All Countries (Million Cubic Feet) | ||||||||
| Year | Jan | Feb | Mar | Apr | May | Jun | Jul | Aug | Sep | Oct | Nov | Dec |
|---|---|---|---|---|---|---|---|---|---|---|---|---|
| 2019 | 3,253 | |||||||||||
| 2020 | 6,084 | 3,697 | 3,725 | 7,391 | 6,456 | 8,924 | ||||||
| 2021 | 6,944 | 6,655 | 9,354 | 9,418 | 7,206 | 7,008 | 7,216 | 5,454 | 9,089 | 5,820 | 10,279 | |
| 2022 | 6,275 | 9,627 | 8,665 | 10,788 | 6,947 | 10,688 | 9,100 | 9,207 | 9,741 | 7,380 | 10,640 | 9,381 |
| 2023 | 9,422 | 10,577 | 11,417 | 7,323 | 7,378 | 12,996 | 9,253 | 2,945 | 11,877 | 6,483 | 8,096 | 10,948 |
| 2024 | 10,512 | 7,009 | 12,835 | 7,189 | 5,848 | 6,412 | 9,740 | 13,607 | 6,871 | 6,360 | 5,239 | 9,768 |
| 2025 | 6,065 | 9,775 | 2,849 | 7,227 | 8,668 | 10,378 | 3,623 | 6,671 | 9,989 | 7,058 | 7,301 | 11,446 |
| 2026 | 5,138 | 3,775 | 7,370 | 7,645 | ||||||||
| - = No Data Reported; -- = Not Applicable; NA = Not Available; W = Withheld to avoid disclosure of individual company data. |
| Release Date: 6/30/2026 |
| Next Release Date: 7/31/2026 |