|
Download Data (XLS File) |
|
||||||||
|
||||||||
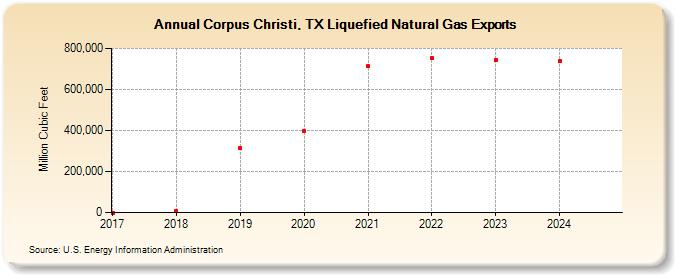
| Corpus Christi, TX Liquefied Natural Gas Exports (Million Cubic Feet) | ||||||||
| Decade | Year-0 | Year-1 | Year-2 | Year-3 | Year-4 | Year-5 | Year-6 | Year-7 | Year-8 | Year-9 |
|---|---|---|---|---|---|---|---|---|---|---|
| 2010's | 0 | 6,864 | 312,501 | |||||||
| 2020's | 395,841 | 712,224 | 753,285 | 742,024 | 739,427 | 839,917 |
| - = No Data Reported; -- = Not Applicable; NA = Not Available; W = Withheld to avoid disclosure of individual company data. |
| Release Date: 5/29/2026 |
| Next Release Date: 6/30/2026 |