|
Download Data (XLS File) |
|
||||||||
|
||||||||
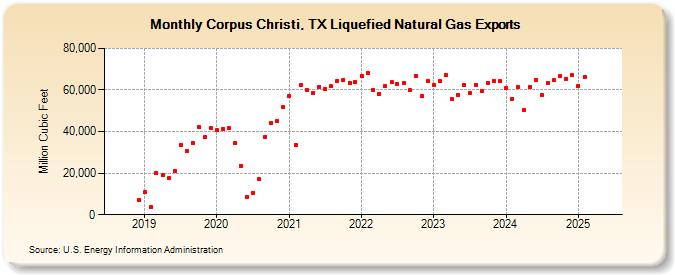
| Corpus Christi, TX Liquefied Natural Gas Exports (Million Cubic Feet) | ||||||||
| Year | Jan | Feb | Mar | Apr | May | Jun | Jul | Aug | Sep | Oct | Nov | Dec |
|---|---|---|---|---|---|---|---|---|---|---|---|---|
| 2018 | 6,864 | |||||||||||
| 2019 | 10,759 | 3,720 | 20,078 | 19,043 | 17,465 | 21,042 | 33,686 | 30,835 | 34,672 | 42,308 | 37,349 | 41,543 |
| 2020 | 40,561 | 41,232 | 41,580 | 34,255 | 23,648 | 8,459 | 10,622 | 17,103 | 37,513 | 44,116 | 44,951 | 51,800 |
| 2021 | 57,216 | 33,330 | 62,591 | 59,861 | 58,768 | 61,536 | 60,477 | 61,749 | 64,392 | 64,835 | 63,495 | 63,975 |
| 2022 | 66,754 | 68,177 | 60,147 | 58,269 | 61,983 | 63,721 | 63,081 | 63,408 | 59,811 | 66,786 | 57,028 | 64,119 |
| 2023 | 62,568 | 64,114 | 67,142 | 55,551 | 57,740 | 62,450 | 58,639 | 62,434 | 59,359 | 63,385 | 64,453 | 64,189 |
| 2024 | 61,078 | 55,752 | 61,274 | 50,129 | 61,508 | 64,581 | 57,384 | 63,539 | 64,644 | 66,780 | 65,495 | 67,263 |
| 2025 | 62,139 | 66,327 | 66,591 | 63,646 | 62,452 | 62,166 | 67,922 | 66,393 | 70,072 | 76,347 | 85,171 | 90,692 |
| 2026 | 83,760 | 85,202 | 95,587 | |||||||||
| - = No Data Reported; -- = Not Applicable; NA = Not Available; W = Withheld to avoid disclosure of individual company data. |
| Release Date: 5/29/2026 |
| Next Release Date: 6/30/2026 |