|
Download Data (XLS File) |
|
||||||||
|
||||||||
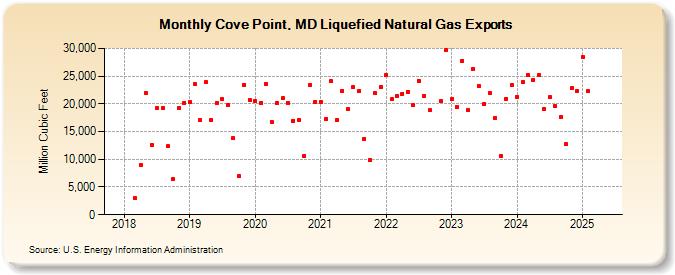
| Cove Point, MD Liquefied Natural Gas Exports (Million Cubic Feet) | ||||||||
| Year | Jan | Feb | Mar | Apr | May | Jun | Jul | Aug | Sep | Oct | Nov | Dec |
|---|---|---|---|---|---|---|---|---|---|---|---|---|
| 2018 | 2,998 | 8,941 | 21,910 | 12,580 | 19,191 | 19,231 | 12,346 | 6,428 | 19,297 | 20,213 | ||
| 2019 | 20,318 | 23,505 | 17,036 | 23,875 | 17,122 | 20,125 | 20,800 | 19,874 | 13,756 | 6,945 | 23,456 | 20,739 |
| 2020 | 20,525 | 20,162 | 23,622 | 16,736 | 20,142 | 20,992 | 20,235 | 16,964 | 17,082 | 10,621 | 23,437 | 20,419 |
| 2021 | 20,408 | 17,235 | 24,043 | 17,115 | 22,389 | 19,058 | 23,036 | 22,339 | 13,735 | 9,903 | 21,927 | 23,047 |
| 2022 | 25,195 | 20,857 | 21,434 | 21,846 | 22,215 | 19,703 | 24,201 | 21,423 | 18,828 | 20,425 | 29,787 | |
| 2023 | 20,791 | 19,429 | 27,759 | 18,816 | 26,266 | 23,253 | 19,927 | 21,934 | 17,465 | 10,676 | 20,932 | 23,434 |
| 2024 | 21,289 | 23,882 | 25,203 | 24,263 | 25,156 | 19,116 | 21,181 | 19,542 | 17,592 | 12,741 | 22,876 | 22,322 |
| 2025 | 28,431 | 22,293 | 25,095 | 20,853 | 24,079 | 24,750 | 21,342 | 22,704 | 14,877 | 15,539 | 19,894 | 28,644 |
| 2026 | 23,836 | 18,464 | 26,671 | 20,970 | ||||||||
| - = No Data Reported; -- = Not Applicable; NA = Not Available; W = Withheld to avoid disclosure of individual company data. |
| Release Date: 6/30/2026 |
| Next Release Date: 7/31/2026 |