|
Download Data (XLS File) |
|
||||||||
|
||||||||
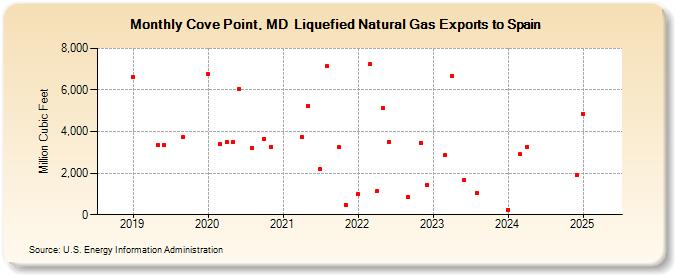
| Cove Point, MD Liquefied Natural Gas Exports to Spain (Million Cubic Feet) | ||||||||
| Year | Jan | Feb | Mar | Apr | May | Jun | Jul | Aug | Sep | Oct | Nov | Dec |
|---|---|---|---|---|---|---|---|---|---|---|---|---|
| 2019 | 6,631 | 3,360 | 3,374 | 3,715 | ||||||||
| 2020 | 6,782 | 3,386 | 3,479 | 3,486 | 6,070 | 3,222 | 3,660 | 3,274 | ||||
| 2021 | 3,750 | 5,234 | 2,184 | 7,138 | 3,243 | 470 | ||||||
| 2022 | 1,007 | 7,244 | 1,127 | 5,122 | 3,489 | 855 | 3,468 | 1,412 | ||||
| 2023 | 2,880 | 6,691 | 1,659 | 1,043 | ||||||||
| 2024 | 243 | 2,909 | 3,276 | 1,890 | ||||||||
| 2025 | 4,868 | 2,896 | 2,770 | 5,706 | 3,308 | 4,896 | 2,835 | |||||
| 2026 | 2,101 | 5,071 | ||||||||||
| - = No Data Reported; -- = Not Applicable; NA = Not Available; W = Withheld to avoid disclosure of individual company data. |
| Release Date: 6/30/2026 |
| Next Release Date: 7/31/2026 |