|
Download Data (XLS File) |
|
||||||||
|
||||||||
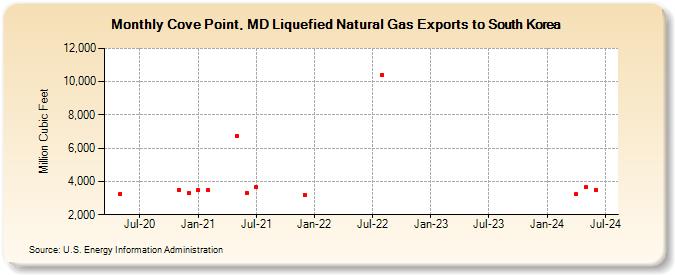
| Cove Point, MD Liquefied Natural Gas Exports to South Korea (Million Cubic Feet) | ||||||||
| Year | Jan | Feb | Mar | Apr | May | Jun | Jul | Aug | Sep | Oct | Nov | Dec |
|---|---|---|---|---|---|---|---|---|---|---|---|---|
| 2020 | 3,264 | 3,473 | 3,282 | |||||||||
| 2021 | 3,457 | 3,465 | 6,757 | 3,317 | 3,642 | 3,211 | ||||||
| 2022 | 10,428 | |||||||||||
| 2024 | 3,245 | 3,638 | 3,491 | |||||||||
| 2025 | 3,700 | |||||||||||
| - = No Data Reported; -- = Not Applicable; NA = Not Available; W = Withheld to avoid disclosure of individual company data. |
| Release Date: 6/30/2026 |
| Next Release Date: 7/31/2026 |