|
Download Data (XLS File) |
|
||||||||
|
||||||||
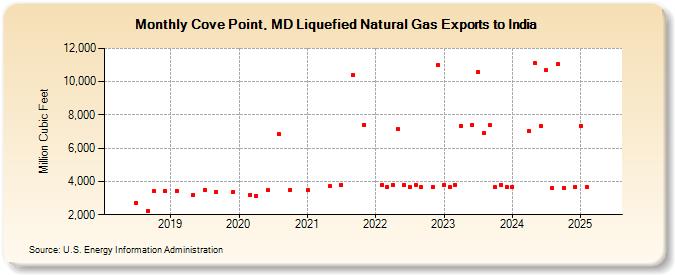
| Cove Point, MD Liquefied Natural Gas Exports to India (Million Cubic Feet) | ||||||||
| Year | Jan | Feb | Mar | Apr | May | Jun | Jul | Aug | Sep | Oct | Nov | Dec |
|---|---|---|---|---|---|---|---|---|---|---|---|---|
| 2018 | 2,700 | 2,243 | 3,412 | 3,438 | ||||||||
| 2019 | 3,431 | 3,212 | 3,485 | 3,387 | 3,393 | |||||||
| 2020 | 3,203 | 3,143 | 3,459 | 6,844 | 3,495 | |||||||
| 2021 | 3,469 | 3,703 | 3,787 | 10,391 | 7,416 | |||||||
| 2022 | 3,813 | 3,682 | 3,808 | 7,152 | 3,808 | 3,669 | 3,804 | 3,660 | 3,658 | 10,975 | ||
| 2023 | 3,797 | 3,657 | 3,810 | 7,338 | 7,416 | 10,590 | 6,889 | 7,369 | 3,644 | 3,791 | 3,637 | |
| 2024 | 3,669 | 7,013 | 11,103 | 7,309 | 10,685 | 3,602 | 11,052 | 3,611 | 3,685 | |||
| 2025 | 7,352 | 3,695 | 7,483 | 3,643 | 7,304 | 7,296 | 11,126 | 7,289 | 7,512 | 7,415 | 7,497 | 7,358 |
| 2026 | 3,688 | 7,521 | 7,344 | 7,484 | ||||||||
| - = No Data Reported; -- = Not Applicable; NA = Not Available; W = Withheld to avoid disclosure of individual company data. |
| Release Date: 6/30/2026 |
| Next Release Date: 7/31/2026 |