|
Download Data (XLS File) |
|
||||||||
|
||||||||
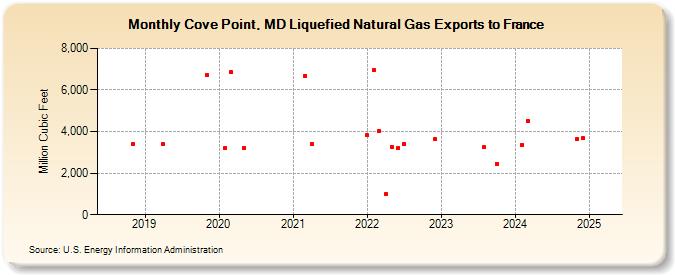
| Cove Point, MD Liquefied Natural Gas Exports to France (Million Cubic Feet) | ||||||||
| Year | Jan | Feb | Mar | Apr | May | Jun | Jul | Aug | Sep | Oct | Nov | Dec |
|---|---|---|---|---|---|---|---|---|---|---|---|---|
| 2018 | 3,380 | |||||||||||
| 2019 | 3,381 | 6,727 | ||||||||||
| 2020 | 3,199 | 6,849 | 3,230 | |||||||||
| 2021 | 6,687 | 3,400 | ||||||||||
| 2022 | 3,816 | 6,960 | 4,027 | 996 | 3,261 | 3,212 | 3,407 | 3,638 | ||||
| 2023 | 3,235 | 2,457 | ||||||||||
| 2024 | 3,368 | 4,527 | 3,653 | 3,667 | ||||||||
| 2025 | 3,701 | 3,542 | 1,143 | 3,687 | 2,486 | 3,692 | ||||||
| 2026 | 3,605 | |||||||||||
| - = No Data Reported; -- = Not Applicable; NA = Not Available; W = Withheld to avoid disclosure of individual company data. |
| Release Date: 6/30/2026 |
| Next Release Date: 7/31/2026 |