|
Download Data (XLS File) |
|
||||||||
|
||||||||
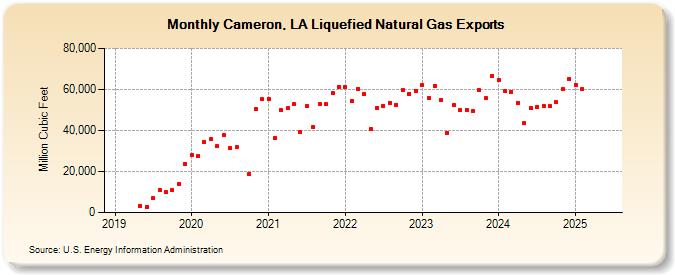
| Cameron, LA Liquefied Natural Gas Exports (Million Cubic Feet) | ||||||||
| Year | Jan | Feb | Mar | Apr | May | Jun | Jul | Aug | Sep | Oct | Nov | Dec |
|---|---|---|---|---|---|---|---|---|---|---|---|---|
| 2019 | 3,210 | 2,917 | 7,054 | 11,048 | 10,008 | 10,791 | 13,945 | 23,902 | ||||
| 2020 | 27,879 | 27,777 | 34,363 | 35,797 | 32,275 | 37,602 | 31,261 | 31,755 | 18,831 | 50,585 | 55,134 | |
| 2021 | 55,260 | 36,484 | 49,901 | 50,863 | 52,767 | 39,017 | 51,774 | 41,733 | 52,808 | 52,670 | 58,144 | 61,387 |
| 2022 | 61,166 | 54,354 | 60,374 | 57,657 | 40,545 | 51,192 | 52,099 | 53,456 | 52,629 | 59,549 | 57,984 | 59,389 |
| 2023 | 62,078 | 55,868 | 61,874 | 54,825 | 38,893 | 52,181 | 49,802 | 50,072 | 49,361 | 59,543 | 55,662 | 66,379 |
| 2024 | 61,930 | 59,314 | 58,931 | 53,559 | 43,444 | 50,901 | 51,606 | 52,029 | 51,894 | 53,660 | 60,071 | 65,160 |
| 2025 | 62,371 | 60,182 | 59,910 | 60,419 | 41,018 | 46,156 | 54,330 | 55,049 | 55,377 | 56,798 | 58,912 | 70,037 |
| 2026 | 64,069 | 58,275 | 65,337 | 58,150 | ||||||||
| - = No Data Reported; -- = Not Applicable; NA = Not Available; W = Withheld to avoid disclosure of individual company data. |
| Release Date: 6/30/2026 |
| Next Release Date: 7/31/2026 |