|
Download Data (XLS File) |
|
||||||||
|
||||||||
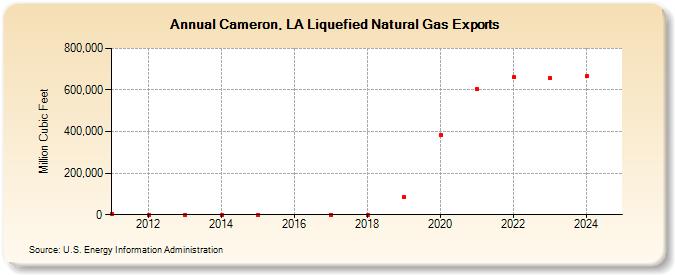
| Cameron, LA Liquefied Natural Gas Exports (Million Cubic Feet) | ||||||||
| Decade | Year-0 | Year-1 | Year-2 | Year-3 | Year-4 | Year-5 | Year-6 | Year-7 | Year-8 | Year-9 |
|---|---|---|---|---|---|---|---|---|---|---|
| 2010's | 5,653 | 0 | 0 | 0 | 0 | 0 | 0 | 82,876 | ||
| 2020's | 382,405 | 602,807 | 660,394 | 656,539 | 662,499 | 679,589 |
| - = No Data Reported; -- = Not Applicable; NA = Not Available; W = Withheld to avoid disclosure of individual company data. |
| Release Date: 4/30/2026 |
| Next Release Date: 5/29/2026 |