|
Download Data (XLS File) |
|
||||||||
|
||||||||
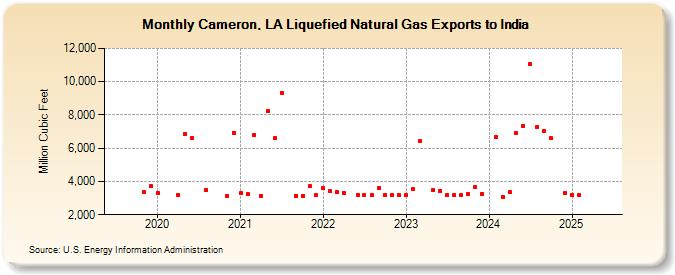
| Cameron, LA Liquefied Natural Gas Exports to India (Million Cubic Feet) | ||||||||
| Year | Jan | Feb | Mar | Apr | May | Jun | Jul | Aug | Sep | Oct | Nov | Dec |
|---|---|---|---|---|---|---|---|---|---|---|---|---|
| 2019 | 3,340 | 3,697 | ||||||||||
| 2020 | 3,309 | 3,195 | 6,857 | 6,641 | 3,475 | 3,136 | 6,930 | |||||
| 2021 | 3,287 | 3,260 | 6,792 | 3,148 | 8,208 | 6,588 | 9,303 | 3,149 | 3,147 | 3,739 | 3,159 | |
| 2022 | 3,577 | 3,397 | 3,337 | 3,298 | 3,215 | 3,170 | 3,175 | 3,593 | 3,169 | 3,172 | 3,165 | |
| 2023 | 3,159 | 3,524 | 6,420 | 3,459 | 3,433 | 3,157 | 3,159 | 3,159 | 3,242 | 3,650 | 3,262 | |
| 2024 | 6,679 | 3,082 | 3,359 | 6,884 | 7,327 | 11,055 | 7,302 | 7,009 | 6,592 | 3,290 | ||
| 2025 | 3,174 | 3,185 | 3,180 | 3,365 | 3,635 | 6,751 | 7,142 | 3,390 | 3,255 | 6,849 | 3,470 | |
| 2026 | 3,179 | 3,306 | 3,483 | 3,420 | ||||||||
| - = No Data Reported; -- = Not Applicable; NA = Not Available; W = Withheld to avoid disclosure of individual company data. |
| Release Date: 6/30/2026 |
| Next Release Date: 7/31/2026 |