|
Download Data (XLS File) |
|
||||||||
|
||||||||
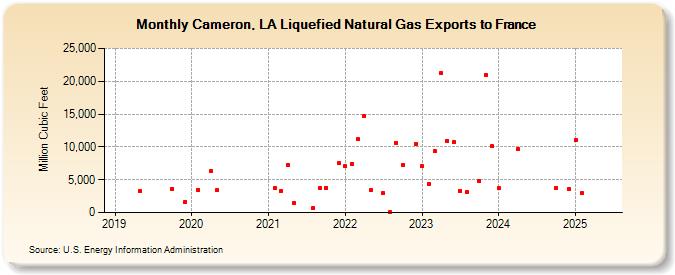
| Cameron, LA Liquefied Natural Gas Exports to France (Million Cubic Feet) | ||||||||
| Year | Jan | Feb | Mar | Apr | May | Jun | Jul | Aug | Sep | Oct | Nov | Dec |
|---|---|---|---|---|---|---|---|---|---|---|---|---|
| 2019 | 3,210 | 3,650 | 1,640 | |||||||||
| 2020 | 3,499 | 6,389 | 3,414 | |||||||||
| 2021 | 3,669 | 3,309 | 7,298 | 1,489 | 680 | 3,684 | 3,810 | 7,478 | ||||
| 2022 | 7,025 | 7,438 | 11,152 | 14,630 | 3,362 | 2,949 | 41 | 10,648 | 7,243 | 10,395 | ||
| 2023 | 7,030 | 4,320 | 9,320 | 21,247 | 10,945 | 10,717 | 3,349 | 3,126 | 4,775 | 20,972 | 10,072 | |
| 2024 | 3,683 | 9,667 | 3,668 | 3,569 | ||||||||
| 2025 | 11,011 | 2,931 | 3,433 | 6,486 | 7,183 | 5,877 | 3,626 | 2,611 | 3,708 | 7,097 | ||
| 2026 | 3,278 | 3,905 | 3,693 | |||||||||
| - = No Data Reported; -- = Not Applicable; NA = Not Available; W = Withheld to avoid disclosure of individual company data. |
| Release Date: 6/30/2026 |
| Next Release Date: 7/31/2026 |