|
Download Data (XLS File) |
|
||||||||
|
||||||||
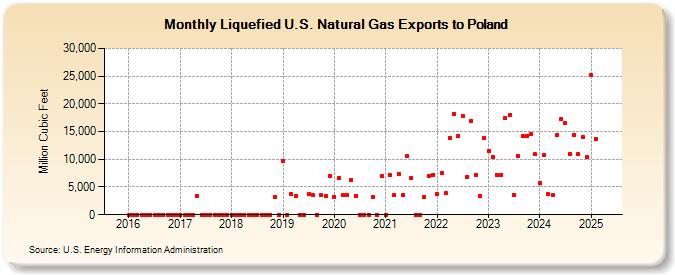
| Liquefied U.S. Natural Gas Exports to Poland (Million Cubic Feet) | ||||||||
| Year | Jan | Feb | Mar | Apr | May | Jun | Jul | Aug | Sep | Oct | Nov | Dec |
|---|---|---|---|---|---|---|---|---|---|---|---|---|
| 2016 | 0 | 0 | 0 | 0 | 0 | 0 | 0 | 0 | 0 | 0 | 0 | 0 |
| 2017 | 0 | 0 | 0 | 0 | 3,440 | 0 | 0 | 0 | 0 | 0 | 0 | 0 |
| 2018 | 0 | 0 | 0 | 0 | 0 | 0 | 0 | 0 | 0 | 0 | 3,231 | 0 |
| 2019 | 9,762 | 0 | 3,701 | 3,414 | 0 | 0 | 3,694 | 3,537 | 0 | 3,489 | 3,432 | 7,013 |
| 2020 | 3,282 | 6,677 | 3,583 | 3,523 | 6,258 | 3,385 | 0 | 0 | 0 | 3,157 | 0 | 7,033 |
| 2021 | 0 | 7,099 | 3,507 | 7,382 | 3,581 | 10,635 | 6,619 | 0 | 0 | 3,270 | 7,068 | 7,159 |
| 2022 | 3,695 | 7,475 | 3,831 | 13,882 | 18,224 | 14,282 | 17,780 | 6,885 | 16,917 | 7,095 | 3,453 | 13,885 |
| 2023 | 11,538 | 10,347 | 7,236 | 7,165 | 17,422 | 18,046 | 3,635 | 10,550 | 14,121 | 14,213 | 14,500 | 10,862 |
| 2024 | 5,746 | 10,702 | 3,685 | 3,576 | 14,363 | 17,301 | 16,541 | 11,026 | 14,417 | 10,866 | 14,011 | 10,333 |
| 2025 | 25,138 | 13,702 | 21,292 | 25,452 | 21,482 | 10,808 | 21,201 | 18,397 | 10,929 | 24,465 | 14,828 | 21,747 |
| 2026 | 23,309 | 23,459 | 14,663 | 22,609 | ||||||||
| - = No Data Reported; -- = Not Applicable; NA = Not Available; W = Withheld to avoid disclosure of individual company data. |
| Release Date: 6/30/2026 |
| Next Release Date: 7/31/2026 |