|
Download Data (XLS File) |
|
||||||||
|
||||||||
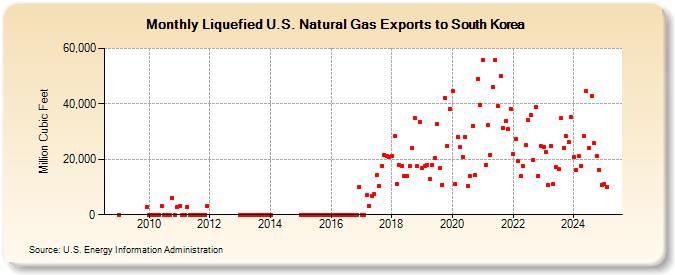
| Liquefied U.S. Natural Gas Exports to South Korea (Million Cubic Feet) | ||||||||
| Year | Jan | Feb | Mar | Apr | May | Jun | Jul | Aug | Sep | Oct | Nov | Dec |
|---|---|---|---|---|---|---|---|---|---|---|---|---|
| 2009 | 0 | 2,735 | ||||||||||
| 2010 | 0 | 0 | 0 | 0 | 0 | 3,103 | 0 | 0 | 0 | 5,970 | 0 | 2,735 |
| 2011 | 3,157 | 0 | 0 | 2,901 | 0 | 0 | 0 | 0 | 0 | 0 | 0 | 3,085 |
| 2013 | 0 | 0 | 0 | 0 | 0 | 0 | 0 | 0 | 0 | 0 | 0 | 0 |
| 2014 | 0 | |||||||||||
| 2015 | 0 | 0 | 0 | 0 | 0 | 0 | 0 | 0 | 0 | 0 | 0 | 0 |
| 2016 | 0 | 0 | 0 | 0 | 0 | 0 | 0 | 0 | 0 | 0 | 0 | 10,166 |
| 2017 | 0 | 0 | 7,042 | 3,295 | 6,818 | 7,431 | 14,238 | 10,320 | 17,514 | 21,577 | 21,141 | 20,810 |
| 2018 | 21,286 | 28,322 | 11,079 | 17,996 | 17,735 | 13,994 | 14,040 | 17,467 | 24,179 | 34,923 | 17,635 | 33,567 |
| 2019 | 16,981 | 17,750 | 18,013 | 13,000 | 18,069 | 20,402 | 32,663 | 16,995 | 10,818 | 42,233 | 24,962 | 38,139 |
| 2020 | 44,625 | 11,071 | 28,095 | 24,258 | 20,921 | 28,171 | 10,492 | 13,814 | 32,126 | 14,321 | 49,103 | 39,617 |
| 2021 | 55,936 | 18,094 | 32,203 | 21,683 | 46,033 | 55,918 | 39,314 | 50,101 | 31,375 | 33,836 | 30,787 | 38,201 |
| 2022 | 21,824 | 27,489 | 19,289 | 13,813 | 17,538 | 25,054 | 34,342 | 36,033 | 19,736 | 38,844 | 14,069 | 24,700 |
| 2023 | 24,507 | 22,672 | 10,807 | 24,734 | 10,958 | 17,044 | 16,462 | 34,932 | 24,112 | 28,224 | 26,140 | 35,187 |
| 2024 | 20,640 | 16,193 | 21,023 | 17,457 | 28,401 | 44,575 | 24,150 | 42,728 | 25,698 | 21,279 | 16,211 | 10,877 |
| 2025 | 11,020 | 10,034 | 17,255 | 39,835 | 21,207 | 21,572 | 19,477 | 30,014 | 14,148 | 26,651 | 17,636 | 21,613 |
| 2026 | 6,868 | 7,417 | 34,172 | |||||||||
| - = No Data Reported; -- = Not Applicable; NA = Not Available; W = Withheld to avoid disclosure of individual company data. |
| Release Date: 5/29/2026 |
| Next Release Date: 6/30/2026 |