|
Download Data (XLS File) |
|
||||||||
|
||||||||
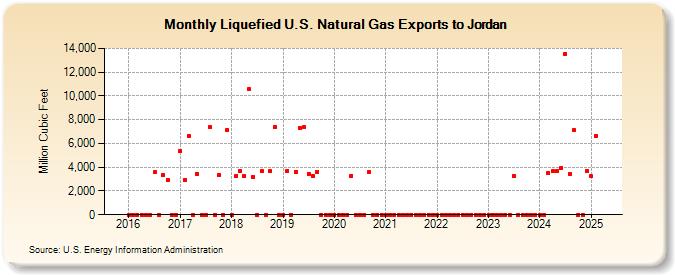
| Liquefied U.S. Natural Gas Exports to Jordan (Million Cubic Feet) | ||||||||
| Year | Jan | Feb | Mar | Apr | May | Jun | Jul | Aug | Sep | Oct | Nov | Dec |
|---|---|---|---|---|---|---|---|---|---|---|---|---|
| 2016 | 0 | 0 | 0 | 0 | 0 | 0 | 3,566 | 0 | 3,362 | 2,942 | 0 | 0 |
| 2017 | 5,368 | 2,945 | 6,655 | 0 | 3,453 | 0 | 0 | 7,393 | 0 | 3,373 | 0 | 7,135 |
| 2018 | 0 | 3,300 | 3,694 | 3,293 | 10,572 | 3,201 | 0 | 3,677 | 0 | 3,666 | 7,390 | 0 |
| 2019 | 0 | 3,695 | 0 | 3,622 | 7,332 | 7,342 | 3,449 | 3,277 | 3,616 | 0 | 0 | 0 |
| 2020 | 0 | 0 | 0 | 0 | 3,294 | 0 | 0 | 0 | 3,578 | 0 | 0 | 0 |
| 2021 | 0 | 0 | 0 | 0 | 0 | 0 | 0 | 0 | 0 | 0 | 0 | 0 |
| 2022 | 0 | 0 | 0 | 0 | 0 | 0 | 0 | 0 | 0 | 0 | 0 | 0 |
| 2023 | 0 | 0 | 0 | 0 | 0 | 0 | 3,282 | 0 | 0 | 0 | 0 | 0 |
| 2024 | 0 | 0 | 3,477 | 3,652 | 3,676 | 3,954 | 13,537 | 3,463 | 7,116 | 0 | 0 | 3,695 |
| 2025 | 3,219 | 6,648 | 10,335 | 3,472 | 0 | 0 | 0 | 3,521 | 0 | 3,609 | 0 | 0 |
| 2026 | 6,961 | 0 | 0 | 0 | ||||||||
| - = No Data Reported; -- = Not Applicable; NA = Not Available; W = Withheld to avoid disclosure of individual company data. |
| Release Date: 6/30/2026 |
| Next Release Date: 7/31/2026 |