|
Download Data (XLS File) |
|
||||||||
|
||||||||
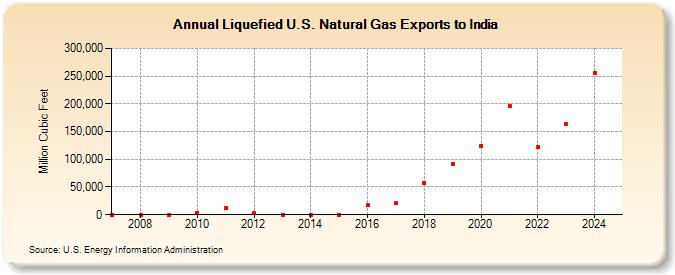
| Liquefied U.S. Natural Gas Exports to India (Million Cubic Feet) | ||||||||
| Decade | Year-0 | Year-1 | Year-2 | Year-3 | Year-4 | Year-5 | Year-6 | Year-7 | Year-8 | Year-9 |
|---|---|---|---|---|---|---|---|---|---|---|
| 2000's | 0 | 0 | 0 | |||||||
| 2010's | 2,873 | 12,542 | 3,004 | 0 | 0 | 0 | 17,462 | 20,919 | 57,634 | 91,481 |
| 2020's | 124,402 | 196,218 | 122,518 | 164,325 | 256,045 | 153,903 |
| - = No Data Reported; -- = Not Applicable; NA = Not Available; W = Withheld to avoid disclosure of individual company data. |
| Release Date: 6/30/2026 |
| Next Release Date: 7/31/2026 |