|
Download Data (XLS File) |
|
||||||||
|
||||||||
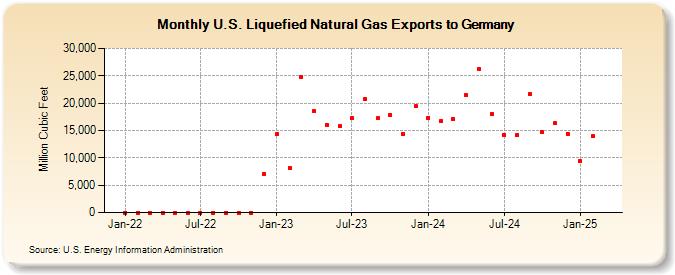
| U.S. Liquefied Natural Gas Exports to Germany (Million Cubic Feet) | ||||||||
| Year | Jan | Feb | Mar | Apr | May | Jun | Jul | Aug | Sep | Oct | Nov | Dec |
|---|---|---|---|---|---|---|---|---|---|---|---|---|
| 2022 | 0 | 0 | 0 | 0 | 0 | 0 | 0 | 0 | 0 | 0 | 1 | 7,112 |
| 2023 | 14,314 | 8,229 | 24,841 | 18,546 | 16,002 | 15,769 | 17,245 | 20,709 | 17,228 | 17,901 | 14,382 | 19,439 |
| 2024 | 17,371 | 16,715 | 17,060 | 21,479 | 26,177 | 17,970 | 14,262 | 14,167 | 21,633 | 14,707 | 16,296 | 14,424 |
| 2025 | 9,370 | 13,938 | 21,377 | 28,264 | 29,212 | 45,727 | 35,515 | 35,236 | 28,307 | 31,236 | 31,852 | 45,804 |
| 2026 | 23,984 | 35,465 | 38,575 | 38,782 | ||||||||
| - = No Data Reported; -- = Not Applicable; NA = Not Available; W = Withheld to avoid disclosure of individual company data. |
| Release Date: 6/30/2026 |
| Next Release Date: 7/31/2026 |