|
Download Data (XLS File) |
|
||||||||
|
||||||||
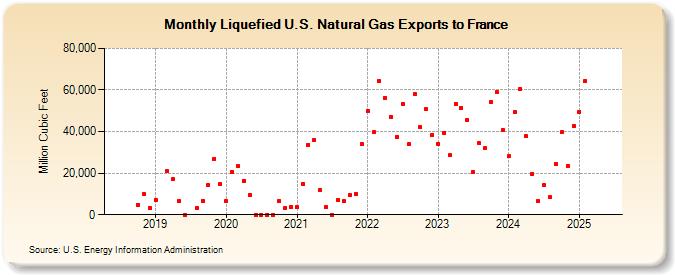
| Liquefied U.S. Natural Gas Exports to France (Million Cubic Feet) | ||||||||
| Year | Jan | Feb | Mar | Apr | May | Jun | Jul | Aug | Sep | Oct | Nov | Dec |
|---|---|---|---|---|---|---|---|---|---|---|---|---|
| 2018 | 4,846 | 9,991 | 3,453 | |||||||||
| 2019 | 7,303 | 20,853 | 17,092 | 6,621 | 0 | 3,249 | 6,740 | 14,228 | 26,946 | 14,758 | ||
| 2020 | 6,563 | 20,520 | 23,491 | 16,336 | 9,546 | 0 | 0 | 0 | 0 | 6,639 | 3,390 | 3,752 |
| 2021 | 3,587 | 14,851 | 33,678 | 36,120 | 11,926 | 3,683 | 0 | 7,111 | 6,578 | 9,333 | 10,021 | 33,892 |
| 2022 | 50,084 | 39,646 | 64,415 | 56,343 | 47,150 | 37,564 | 53,443 | 33,885 | 57,943 | 41,959 | 50,655 | 38,311 |
| 2023 | 34,124 | 39,457 | 28,581 | 53,211 | 51,355 | 45,569 | 20,589 | 34,332 | 32,016 | 54,072 | 58,907 | 40,692 |
| 2024 | 28,049 | 49,363 | 60,572 | 37,672 | 19,797 | 6,630 | 14,207 | 8,293 | 24,388 | 39,630 | 23,601 | 42,622 |
| 2025 | 49,610 | 64,434 | 70,290 | 52,503 | 52,021 | 27,282 | 10,987 | 30,288 | 47,403 | 51,899 | 37,975 | 38,360 |
| 2026 | 45,261 | 32,701 | 61,535 | 46,541 | ||||||||
| - = No Data Reported; -- = Not Applicable; NA = Not Available; W = Withheld to avoid disclosure of individual company data. |
| Release Date: 6/30/2026 |
| Next Release Date: 7/31/2026 |