|
Download Data (XLS File) |
|
||||||||
|
||||||||
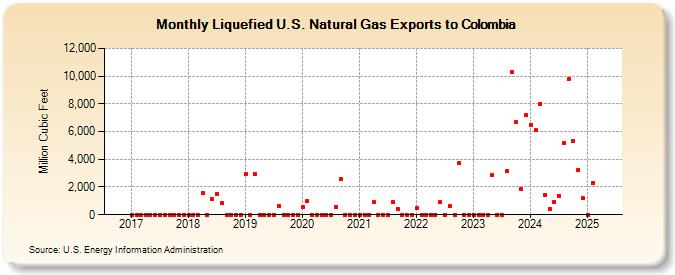
| Liquefied U.S. Natural Gas Exports to Colombia (Million Cubic Feet) | ||||||||
| Year | Jan | Feb | Mar | Apr | May | Jun | Jul | Aug | Sep | Oct | Nov | Dec |
|---|---|---|---|---|---|---|---|---|---|---|---|---|
| 2017 | 0 | 0 | 0 | 0 | 0 | 0 | 0 | 0 | 0 | 0 | 0 | 0 |
| 2018 | 0 | 0 | 0 | 1,599 | 0 | 1,113 | 1,521 | 867 | 0 | 0 | 0 | 0 |
| 2019 | 2,934 | 0 | 2,935 | 0 | 0 | 0 | 0 | 649 | 0 | 0 | 0 | 0 |
| 2020 | 525 | 1,003 | 0 | 0 | 0 | 0 | 0 | 550 | 2,548 | 0 | 0 | 0 |
| 2021 | 0 | 0 | 0 | 892 | 0 | 0 | 0 | 919 | 436 | 0 | 0 | 0 |
| 2022 | 486 | 0 | 0 | 0 | 0 | 912 | 0 | 606 | 0 | 3,699 | 0 | 0 |
| 2023 | 0 | 0 | 0 | 0 | 2,847 | 0 | 0 | 3,149 | 10,322 | 6,689 | 1,844 | 7,162 |
| 2024 | 6,465 | 6,101 | 7,974 | 1,444 | 436 | 953 | 1,376 | 5,160 | 9,766 | 5,326 | 3,243 | 1,170 |
| 2025 | 0 | 2,260 | 3,364 | 9,753 | 4,151 | 3,131 | 3,862 | 994 | 7,323 | 0 | 1,565 | 3,486 |
| 2026 | 3,651 | 964 | 3,182 | 3,355 | ||||||||
| - = No Data Reported; -- = Not Applicable; NA = Not Available; W = Withheld to avoid disclosure of individual company data. |
| Release Date: 6/30/2026 |
| Next Release Date: 7/31/2026 |