|
Download Data (XLS File) |
|
||||||||
|
||||||||
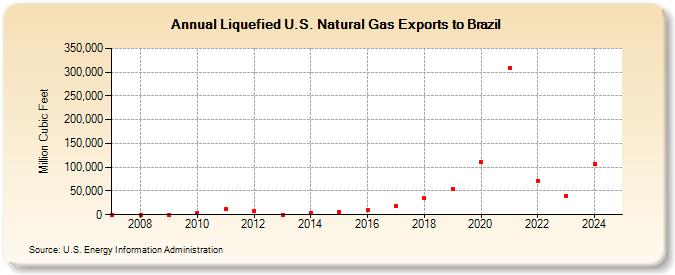
| Liquefied U.S. Natural Gas Exports to Brazil (Million Cubic Feet) | ||||||||
| Decade | Year-0 | Year-1 | Year-2 | Year-3 | Year-4 | Year-5 | Year-6 | Year-7 | Year-8 | Year-9 |
|---|---|---|---|---|---|---|---|---|---|---|
| 2000's | 0 | 0 | 0 | |||||||
| 2010's | 3,279 | 11,049 | 8,142 | 0 | 2,664 | 5,533 | 10,629 | 17,648 | 35,645 | 54,298 |
| 2020's | 111,908 | 307,714 | 71,998 | 38,595 | 105,846 | 88,107 |
| - = No Data Reported; -- = Not Applicable; NA = Not Available; W = Withheld to avoid disclosure of individual company data. |
| Release Date: 6/30/2026 |
| Next Release Date: 7/31/2026 |