|
Download Data (XLS File) |
|
||||||||
|
||||||||
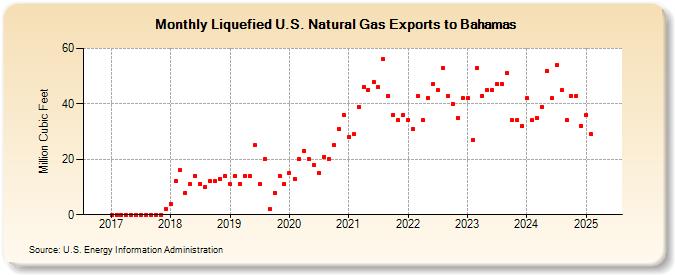
| Liquefied U.S. Natural Gas Exports to Bahamas (Million Cubic Feet) | ||||||||
| Year | Jan | Feb | Mar | Apr | May | Jun | Jul | Aug | Sep | Oct | Nov | Dec |
|---|---|---|---|---|---|---|---|---|---|---|---|---|
| 2017 | 0 | 0 | 0 | 0 | 0 | 0 | 0 | 0 | 0 | 0 | 0 | 2 |
| 2018 | 4 | 12 | 16 | 8 | 11 | 14 | 11 | 10 | 12 | 12 | 13 | 14 |
| 2019 | 11 | 14 | 11 | 14 | 14 | 25 | 11 | 20 | 2 | 8 | 14 | 11 |
| 2020 | 15 | 13 | 20 | 23 | 20 | 18 | 15 | 21 | 20 | 25 | 31 | 36 |
| 2021 | 28 | 29 | 39 | 46 | 45 | 48 | 46 | 56 | 43 | 36 | 34 | 36 |
| 2022 | 34 | 31 | 43 | 34 | 42 | 47 | 45 | 53 | 43 | 40 | 35 | 42 |
| 2023 | 42 | 27 | 53 | 43 | 45 | 45 | 47 | 47 | 51 | 34 | 34 | 32 |
| 2024 | 42 | 34 | 35 | 39 | 52 | 42 | 54 | 45 | 34 | 43 | 43 | 32 |
| 2025 | 36 | 29 | 38 | 39 | 42 | 38 | 49 | 47 | 42 | 31 | 29 | 359 |
| 2026 | 574 | 430 | 555 | 804 | ||||||||
| - = No Data Reported; -- = Not Applicable; NA = Not Available; W = Withheld to avoid disclosure of individual company data. |
| Release Date: 6/30/2026 |
| Next Release Date: 7/31/2026 |