|
Download Data (XLS File) |
|
||||||||
|
||||||||
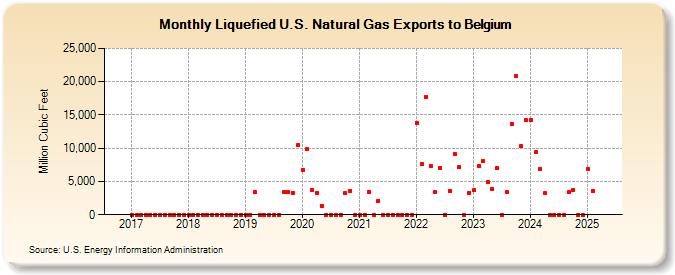
| Liquefied U.S. Natural Gas Exports to Belgium (Million Cubic Feet) | ||||||||
| Year | Jan | Feb | Mar | Apr | May | Jun | Jul | Aug | Sep | Oct | Nov | Dec |
|---|---|---|---|---|---|---|---|---|---|---|---|---|
| 2017 | 0 | 0 | 0 | 0 | 0 | 0 | 0 | 0 | 0 | 0 | 0 | 0 |
| 2018 | 0 | 0 | 0 | 0 | 0 | 0 | 0 | 0 | 0 | 0 | 0 | 0 |
| 2019 | 0 | 0 | 3,390 | 0 | 0 | 0 | 0 | 0 | 3,404 | 3,402 | 3,293 | 10,407 |
| 2020 | 6,761 | 9,872 | 3,724 | 3,324 | 1,348 | 0 | 0 | 0 | 0 | 3,285 | 3,633 | 0 |
| 2021 | 0 | 0 | 3,484 | 0 | 2,100 | 0 | 0 | 0 | 0 | 0 | 0 | 0 |
| 2022 | 13,786 | 7,691 | 17,743 | 7,341 | 3,441 | 7,023 | 0 | 3,589 | 9,165 | 7,190 | 0 | 3,274 |
| 2023 | 3,640 | 7,322 | 8,053 | 4,844 | 3,809 | 6,953 | 0 | 3,363 | 13,697 | 20,775 | 10,288 | 14,272 |
| 2024 | 14,255 | 9,386 | 6,899 | 3,247 | 0 | 0 | 0 | 0 | 3,372 | 3,682 | 0 | 0 |
| 2025 | 6,837 | 3,541 | 23,612 | 10,645 | 13,514 | 13,645 | 9,738 | 17,286 | 27,746 | 35,504 | 17,877 | 17,663 |
| 2026 | 21,153 | 24,867 | 15,819 | 20,525 | ||||||||
| - = No Data Reported; -- = Not Applicable; NA = Not Available; W = Withheld to avoid disclosure of individual company data. |
| Release Date: 6/30/2026 |
| Next Release Date: 7/31/2026 |