|
Download Data (XLS File) |
|
|||||
|
|||||
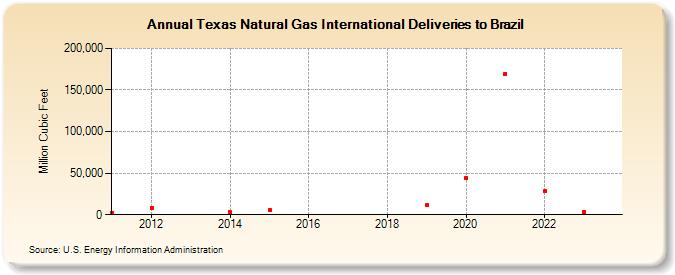
| Texas Natural Gas International Deliveries to Brazil (Million Cubic Feet) | |||||
| Decade | Year-0 | Year-1 | Year-2 | Year-3 | Year-4 | Year-5 | Year-6 | Year-7 | Year-8 | Year-9 |
|---|---|---|---|---|---|---|---|---|---|---|
| 2010's | 2,581 | 8,142 | 2,664 | 5,533 | 11,301 | |||||
| 2020's | 44,102 | 169,536 | 28,483 | 3,720 | 35,483 |
| - = No Data Reported; -- = Not Applicable; NA = Not Available; W = Withheld to avoid disclosure of individual company data. |
| Release Date: 6/30/2026 |
| Next Release Date: 7/31/2026 |
Referring Pages: