|
Download Data (XLS File) |
|
|||||
|
|||||
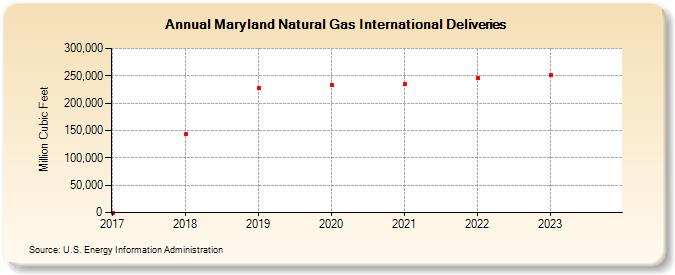
| Maryland Natural Gas International Deliveries (Million Cubic Feet) | |||||
| Decade | Year-0 | Year-1 | Year-2 | Year-3 | Year-4 | Year-5 | Year-6 | Year-7 | Year-8 | Year-9 |
|---|---|---|---|---|---|---|---|---|---|---|
| 2010's | 0 | 143,134 | 227,552 | |||||||
| 2020's | 233,102 | 234,236 | 245,914 | 250,683 | 254,557 |
| - = No Data Reported; -- = Not Applicable; NA = Not Available; W = Withheld to avoid disclosure of individual company data. |
| Release Date: 6/30/2026 |
| Next Release Date: 7/31/2026 |